What are rolling returns in case of mutual funds? Why is this better than point-to-point returns?
This article discusses the concept of rolling returns and explains why investors should use them to choose investments like mutual funds.
This article discusses the concept of rolling returns and explains why investors should use them to choose investments like mutual funds.

Here is an example of a mutual fund that is currently (as of 5-Oct-2023 close) on the top of all performance charts:
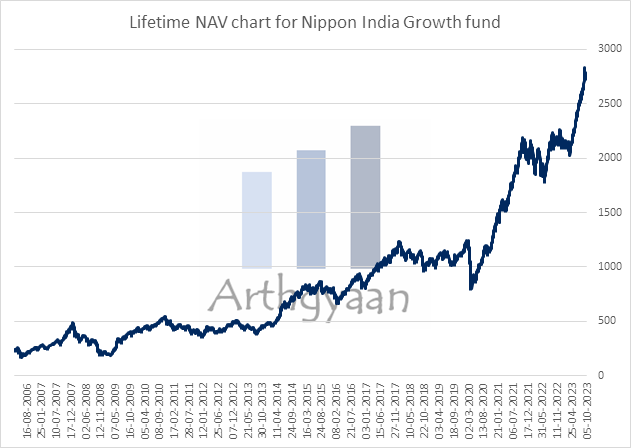
This fund was specifically chosen since, as per Valueresearchonline data, this fund has given the highest 20-year returns, as of 5-Oct-2023, of all mutual funds in India.
Now in general you would have also seen mutual fund performance tables like this:
| Period | Lump sum | SIP |
|---|---|---|
| 1Y | 28.2% | 24.3% |
| 2Y | 16.1% | 18.5% |
| 3Y | 34.1% | 33.5% |
| 5Y | 19.3% | 19.1% |
| 7Y | 17.3% | 18.6% |
| 10Y | 21.4% | 18.4% |
| 15Y | 15.9% | 13.5% |
The above table shows point-to-point data for the period ending 5-Oct-2023. This means that the fund gave a return of 28.2% for a single lump sum investment made a year ago and redeemed on 5-Oct-2023.
Unfortunately, point-to-point data is not suitable for drawing any useful conclusion regarding the fund performance. We can choose the start or end dates to make any point we wish to. For example, here is the same point-to-point performance table for the same fund for the period ending 24-Mar-2020 which is the date the stock market reached a bottom due to the COVID-19 pandemic.
| Period | Lump sum | SIP |
|---|---|---|
| 1Y | -16.6% | -9.3% |
| 2Y | -9.0% | -11.6% |
| 3Y | -0.7% | 1.7% |
| 5Y | 2.4% | 3.7% |
| 7Y | 9.4% | 9.5% |
| 10Y | 8.3% | 9.1% |
Note: We have daily NAV data for this fund only since 2006 and therefore there is no 15Y data for 2020.
If you are a mutual fund distributor selling a fund to a client or a Do-It-Yourself (DIY) investor trying to understand the historical return of a fund, point-to-point data is useless.
We need a better metric to understand the historical returns of assets like mutual funds, stocks, gold, indices (like Nifty 50 or SENSEX or S&P500) or even real estate. That metric is called rolling returns.
Rolling returns are all of the returns that the fund gave for a particular investment period. If, for example, we wish to understand how much returns the fund usually gave for a 10Y lump sum investment, we can list down in a table or chart returns like this:
and so on.
You can now plot these values like X,Y,Z% against the dates 1st Jan 2016, 2nd Jan 2016, 3rd Jan 2016 etc and create a chart like this:
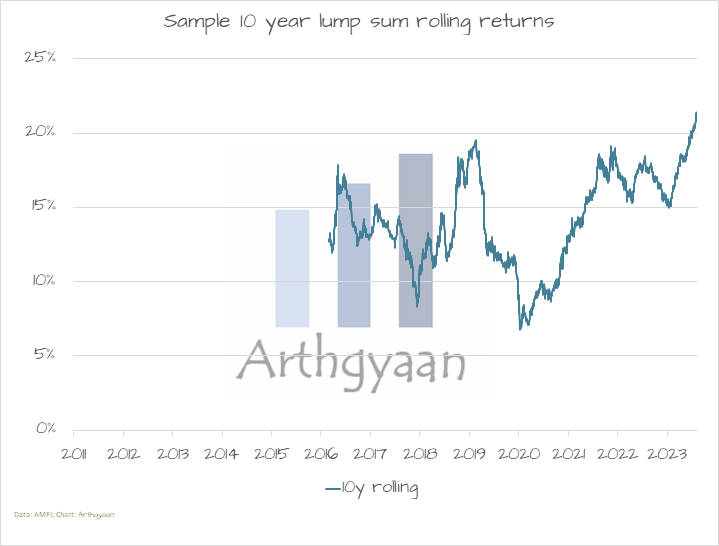
If you are investing monthly i.e. in SIP mode, you can perform the same calculation for 120 months and create a chart like this:
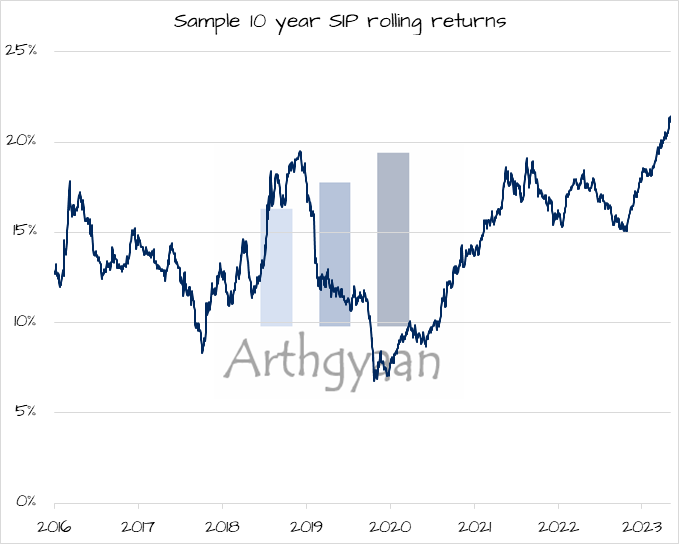
Such charts are rolling return charts and give you a much better idea of the actual returns of the fund for the chosen investment period. For the same fund in the above example, we can create a complete rolling return dashboard like this:
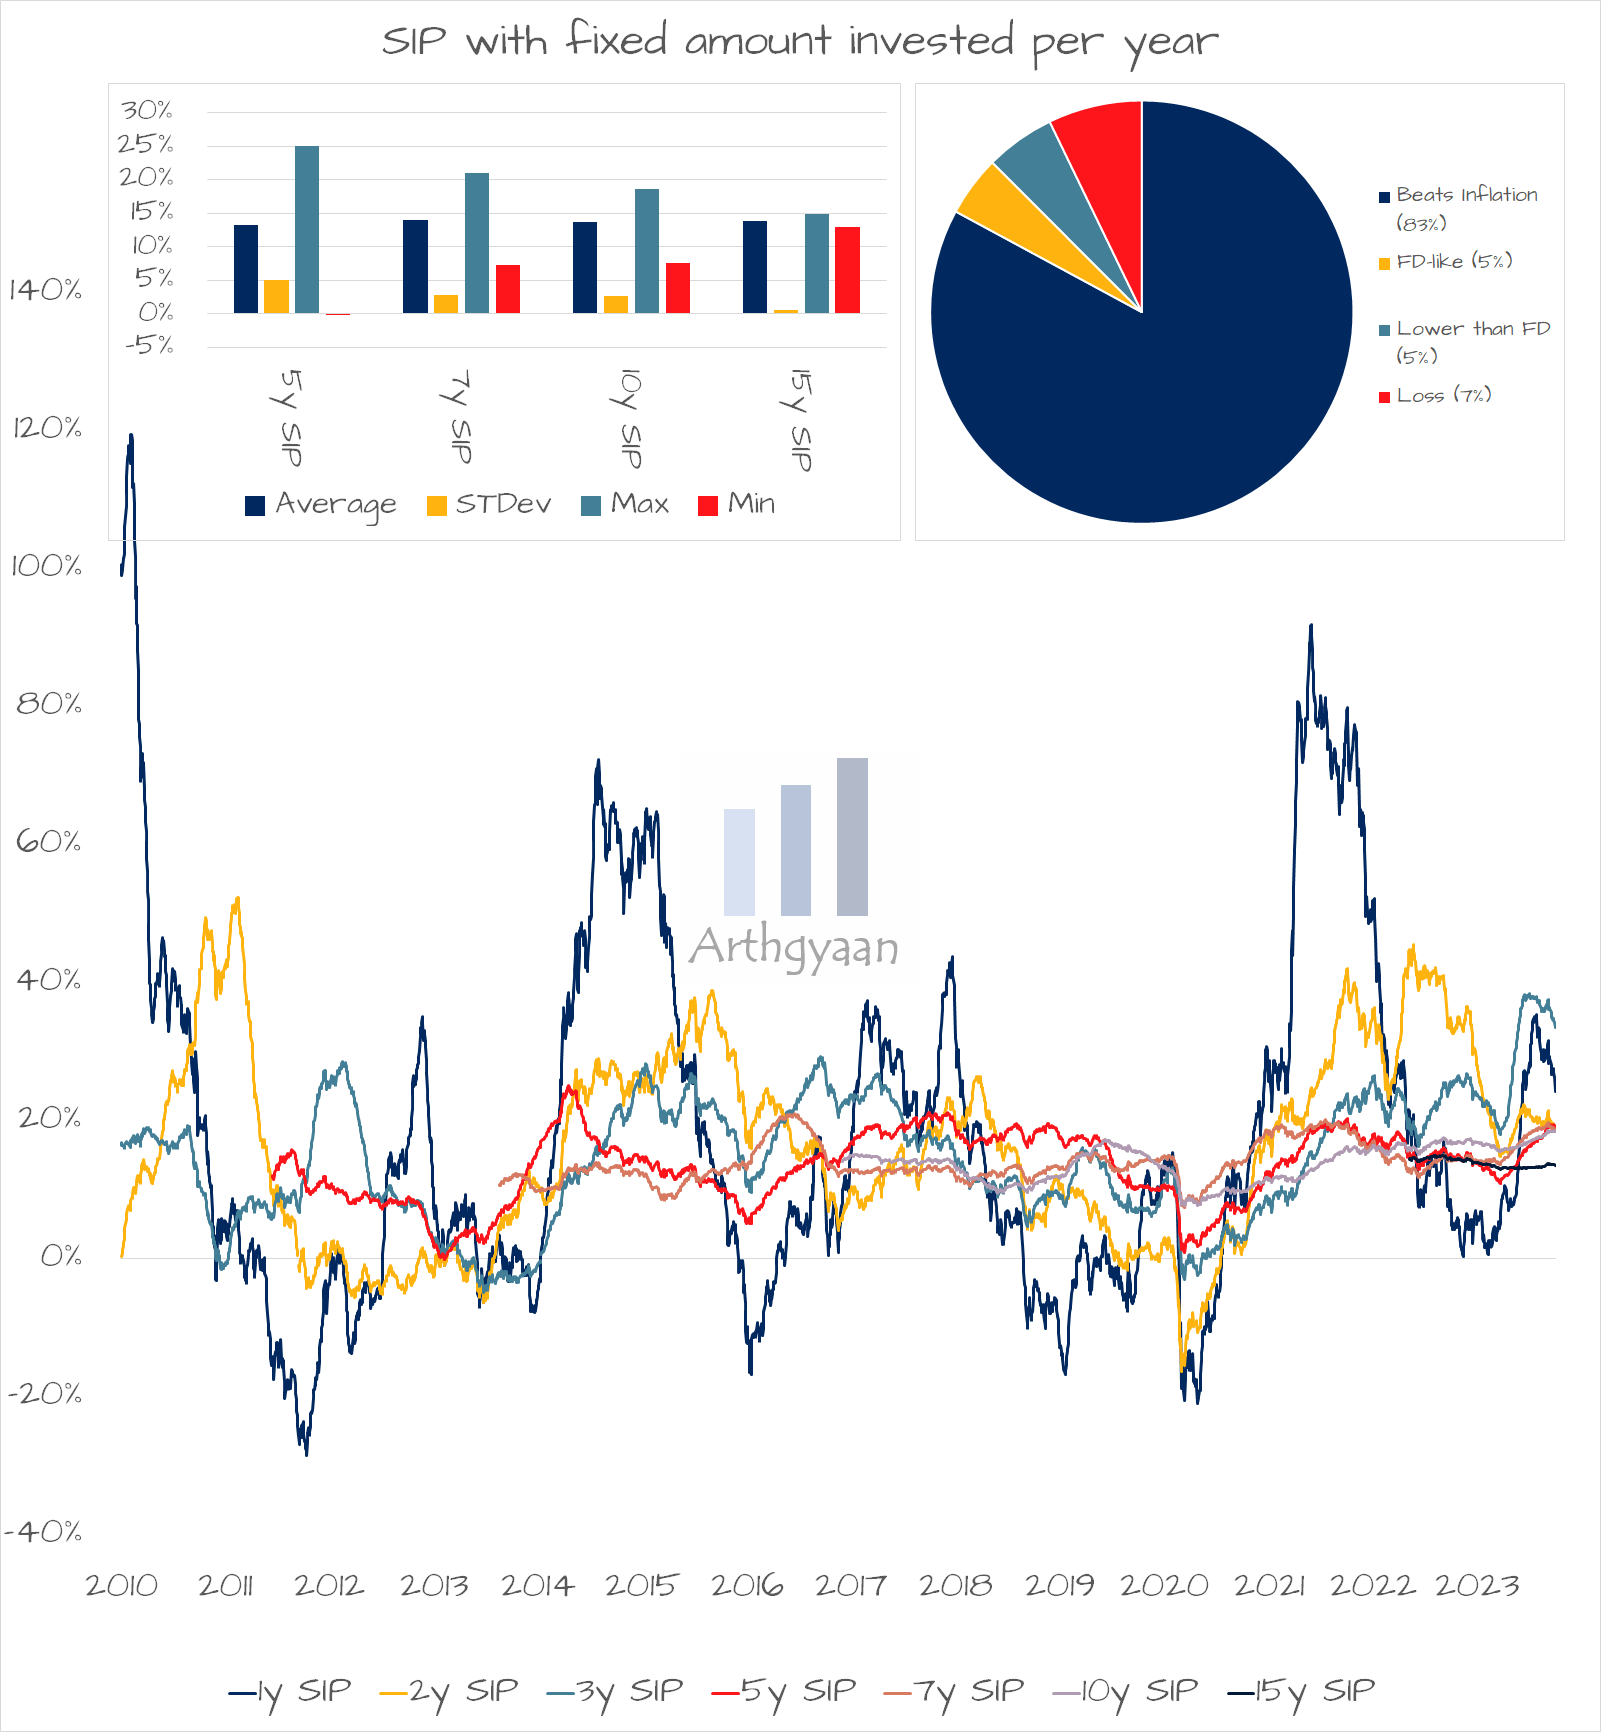
Rolling returns allow us to better understand Lump sum and SIP returns like this:-
For lump sum:
| Period | Best | Median | Worst | Chance of return > 8% | Chance of return > 12% | Chance of losing money |
|---|---|---|---|---|---|---|
| Any 1y | 139% | 12% | -58% | 57% | 50% | 26% |
| Any 2y | 65% | 14% | -17% | 62% | 55% | 18% |
| Any 3y | 39% | 15% | -7% | 74% | 61% | 7% |
| Any 5y | 24% | 14% | 0% | 83% | 65% | 0% |
| Any 7y | 23% | 14% | 7% | 99% | 76% | 0% |
| Any 10y | 21% | 14% | 7% | 97% | 74% | 0% |
| Any 15y | 20% | 13% | 4% | 96% | 75% | 0% |
For SIP:
| Period | Best | Median | Worst | Chance of return > 8% | Chance of return > 12% | Chance of losing money |
|---|---|---|---|---|---|---|
| Any 1y | 119% | 12% | -55% | 56% | 50% | 26% |
| Any 2y | 52% | 14% | -17% | 65% | 54% | 17% |
| Any 3y | 38% | 16% | -5% | 76% | 59% | 7% |
| Any 5y | 25% | 14% | 0% | 84% | 63% | 0% |
| Any 7y | 21% | 13% | 7% | 100% | 82% | 0% |
| Any 10y | 19% | 14% | 8% | 99% | 69% | 0% |
| Any 15y | 15% | 14% | 13% | 100% | 100% | 0% |
We have a data set for rolling returns : What are the rolling returns of SIP and lump sum of direct mutual funds?
We have a good number of articles using the concept of Rolling returns for understanding the returns of different asset classes. Some of these examples are below:
This article provides a list of fund and category-wise statistics of rolling return of SIP and lump sum investments for various mutual funds.
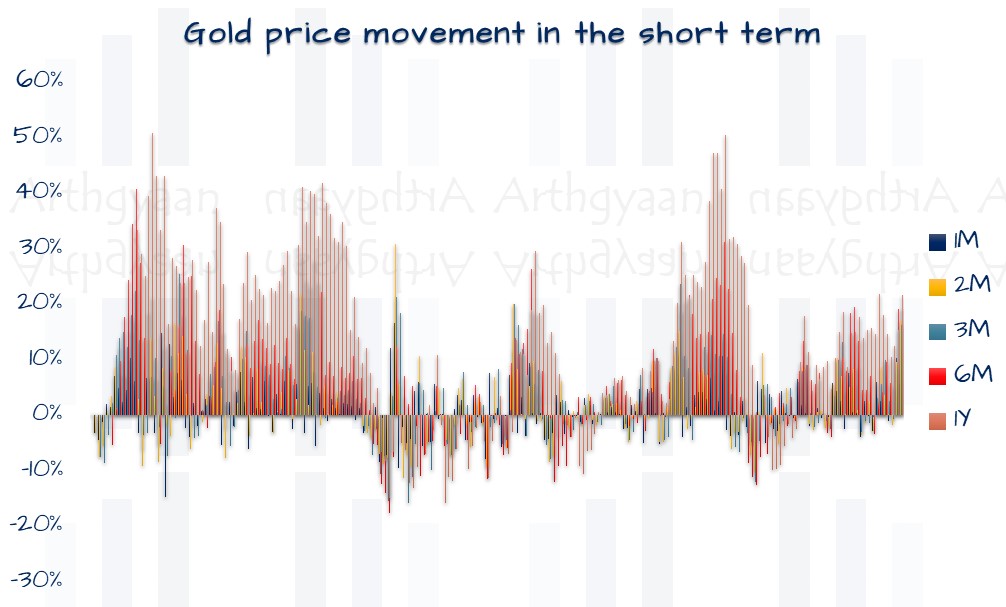
This article explores the probabilities of gold price movement, both up and down, from current price levels.
This article shows you how different categories of hybrid funds have performed for regular SIP investments for short durations.
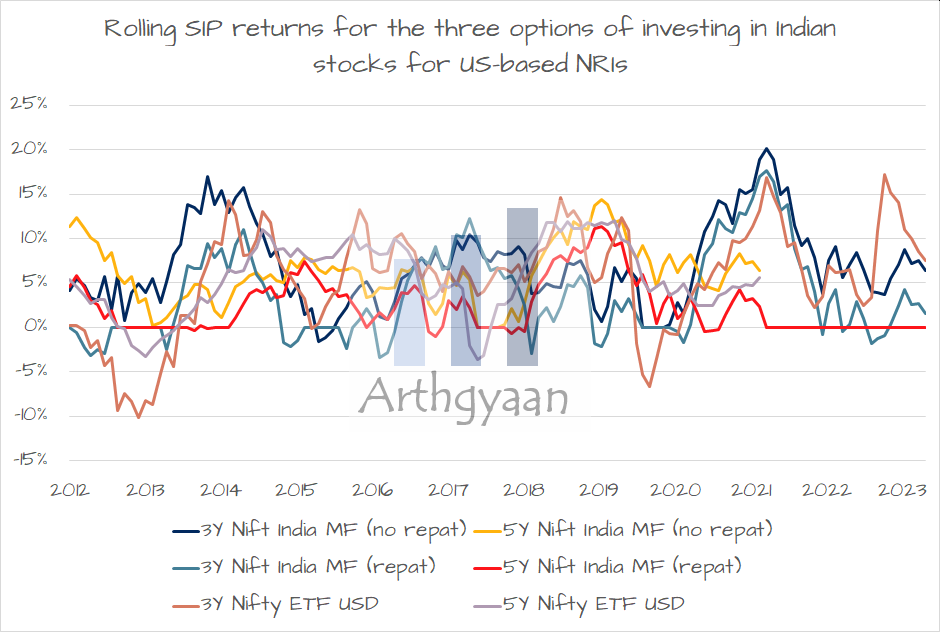
The article uses rolling returns to compare various investment options for US-based NRIs intending to invest in the Indian stock market.
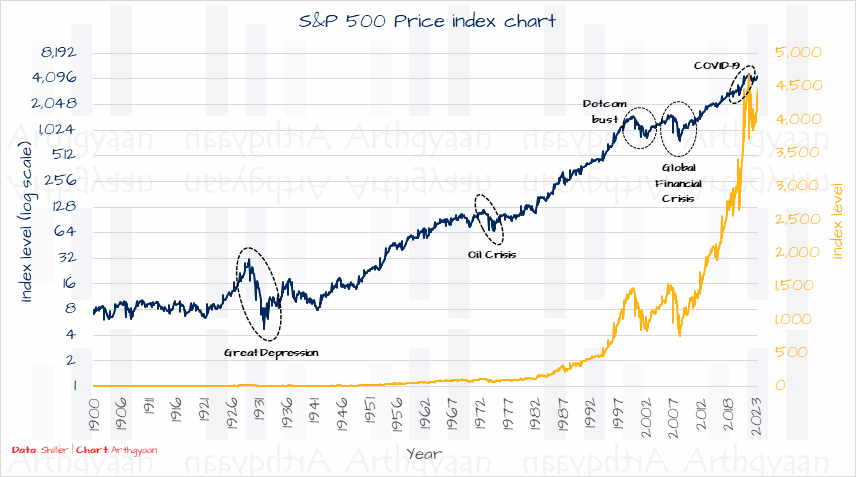
This article explores how much return has come from the US stock market using data from the 1870s.
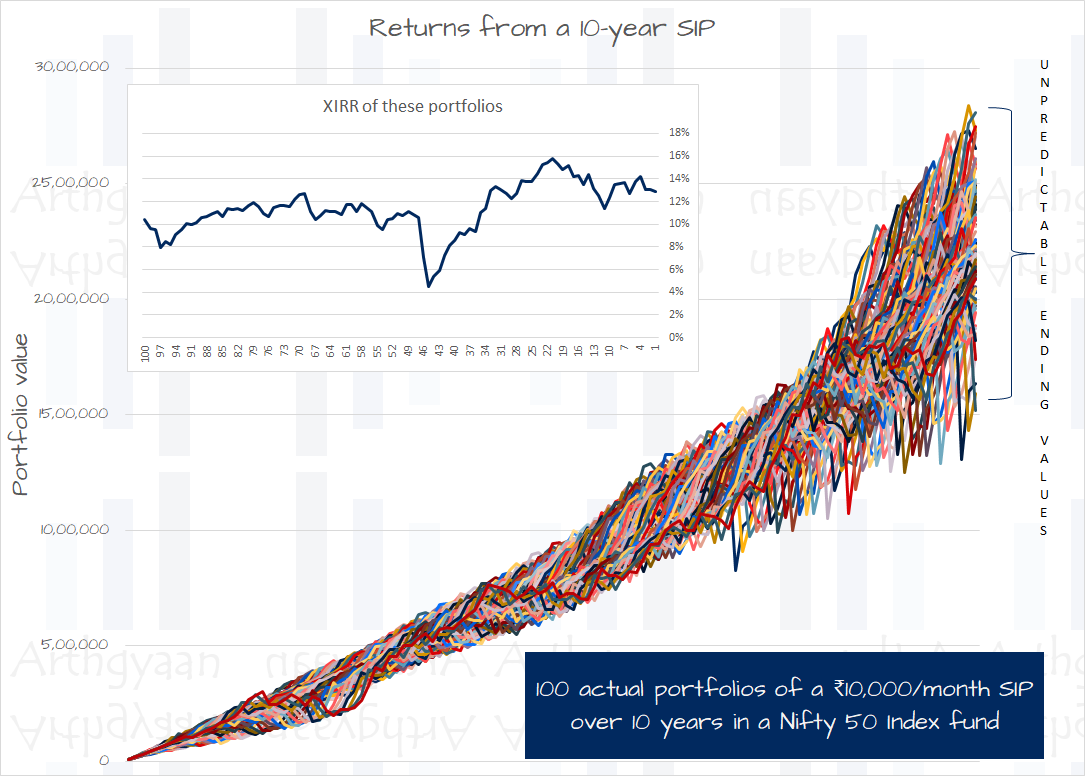
This article shows you that investing via SIP in a mutual fund does not create wealth.
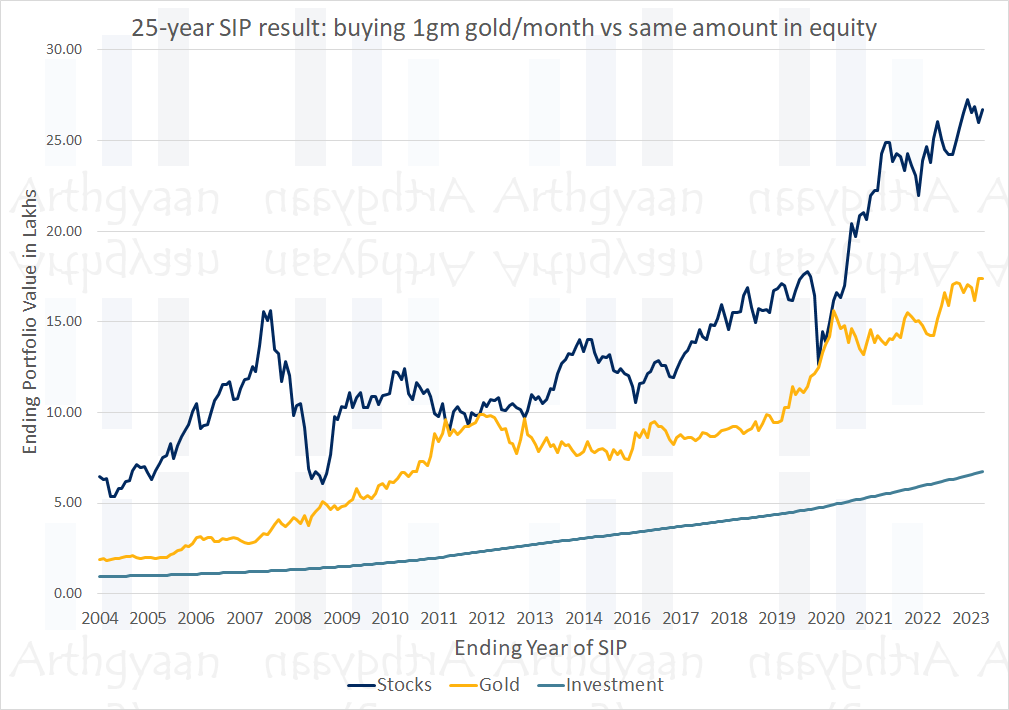
The article shows you if you there is a better alternative to buying gold over time for your child’s marriage goals.
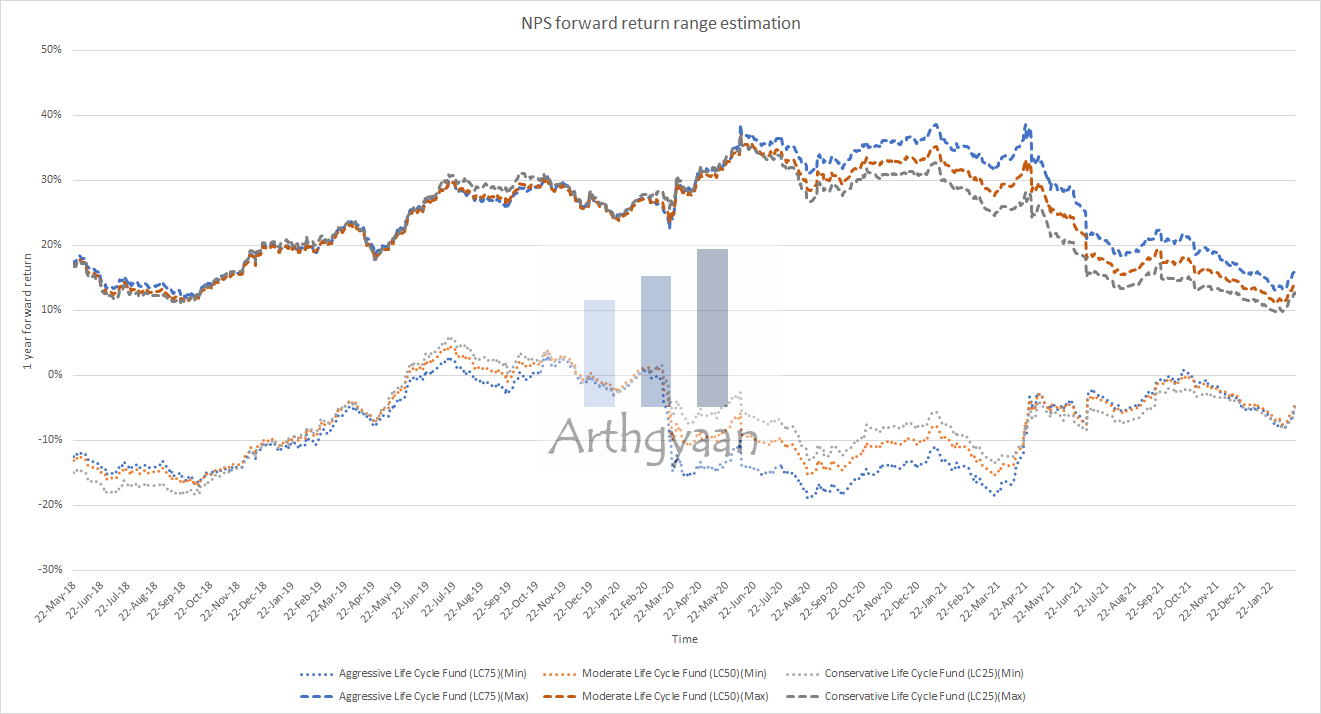
What should you do if there is a fall in your NPS corpus just before retirement at 60? This post details the problems and shows how to remediate the risk.
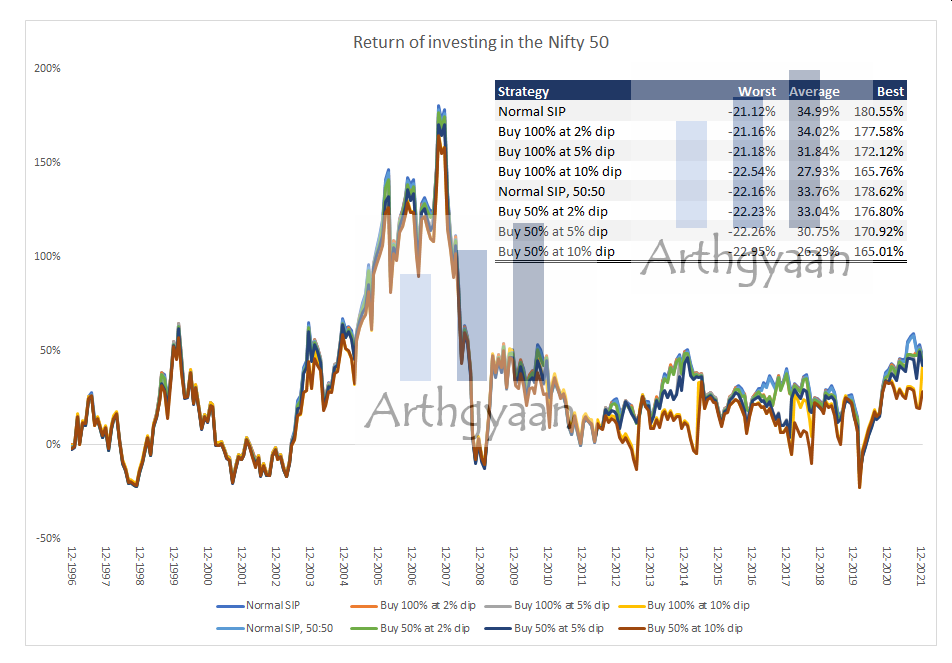
This article talks about short-term changes to your investment strategy to take advantage of downward market movements. Does it work?
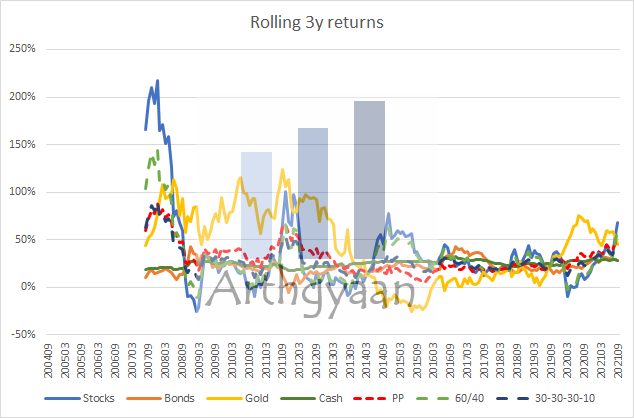
This article analyses if a permanent portfolio (equal proportion of stocks, bonds, gold and cash) works for Indian investors.
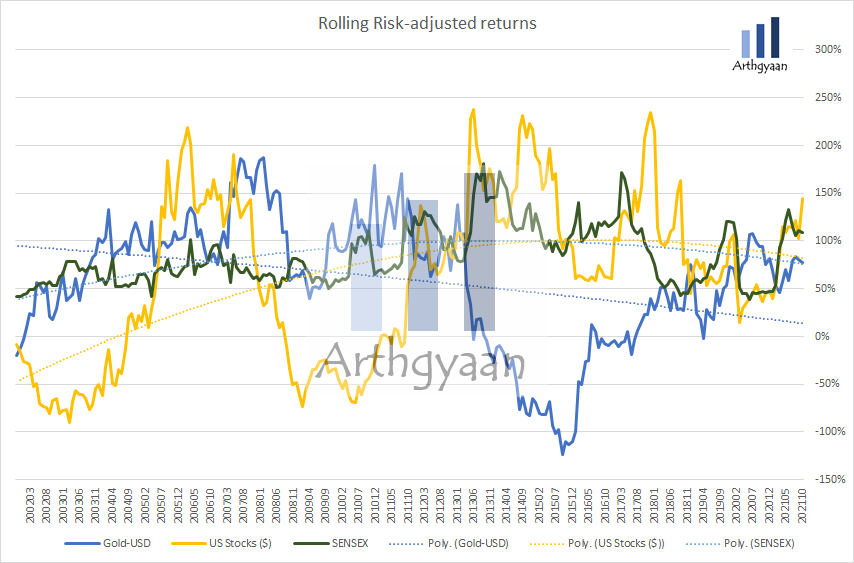
This post answers the question of how and whether investors should include gold in their portfolios.
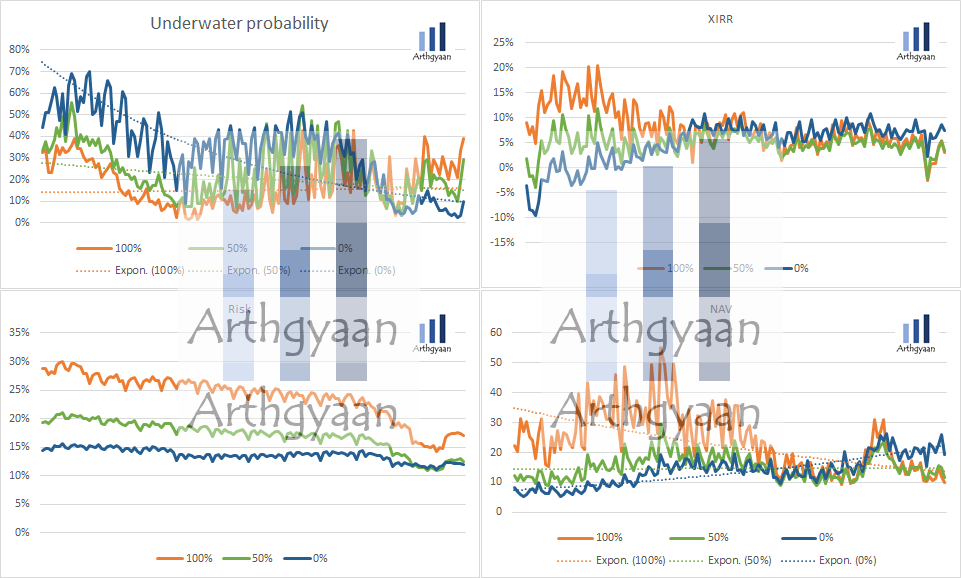
This post answers the question of whether investors should invest outside their home country.
A common comparison in the mutual fund industry is comparing mutual funds and FDs. A recent take on this debate says: “Did you know that even the worst performing equity mutual funds has beaten FD. Imagine what the best performing MF has done.”
We examine that claim here: Do the worst performing equity mutual funds beat FD?.
1. Email me with any questions.
2. Use our goal-based investing template to prepare a financial plan for yourself.Don't forget to share this article on WhatsApp or Twitter or post this to Facebook.
Discuss this post with us via Facebook or get regular bite-sized updates on Twitter.
More posts...Disclaimer: Content on this site is for educational purpose only and is not financial advice. Nothing on this site should be construed as an offer or recommendation to buy/sell any financial product or service. Please consult a registered investment advisor before making any investments.
This post titled What are rolling returns in case of mutual funds? Why is this better than point-to-point returns? first appeared on 08 Oct 2023 at https://arthgyaan.com