Should Indian investors invest 100% in equity for their goals?
This article shows a comparison of different asset-allocation values for debt and equity for different holding periods for Indian investors.
This article shows a comparison of different asset-allocation values for debt and equity for different holding periods for Indian investors.
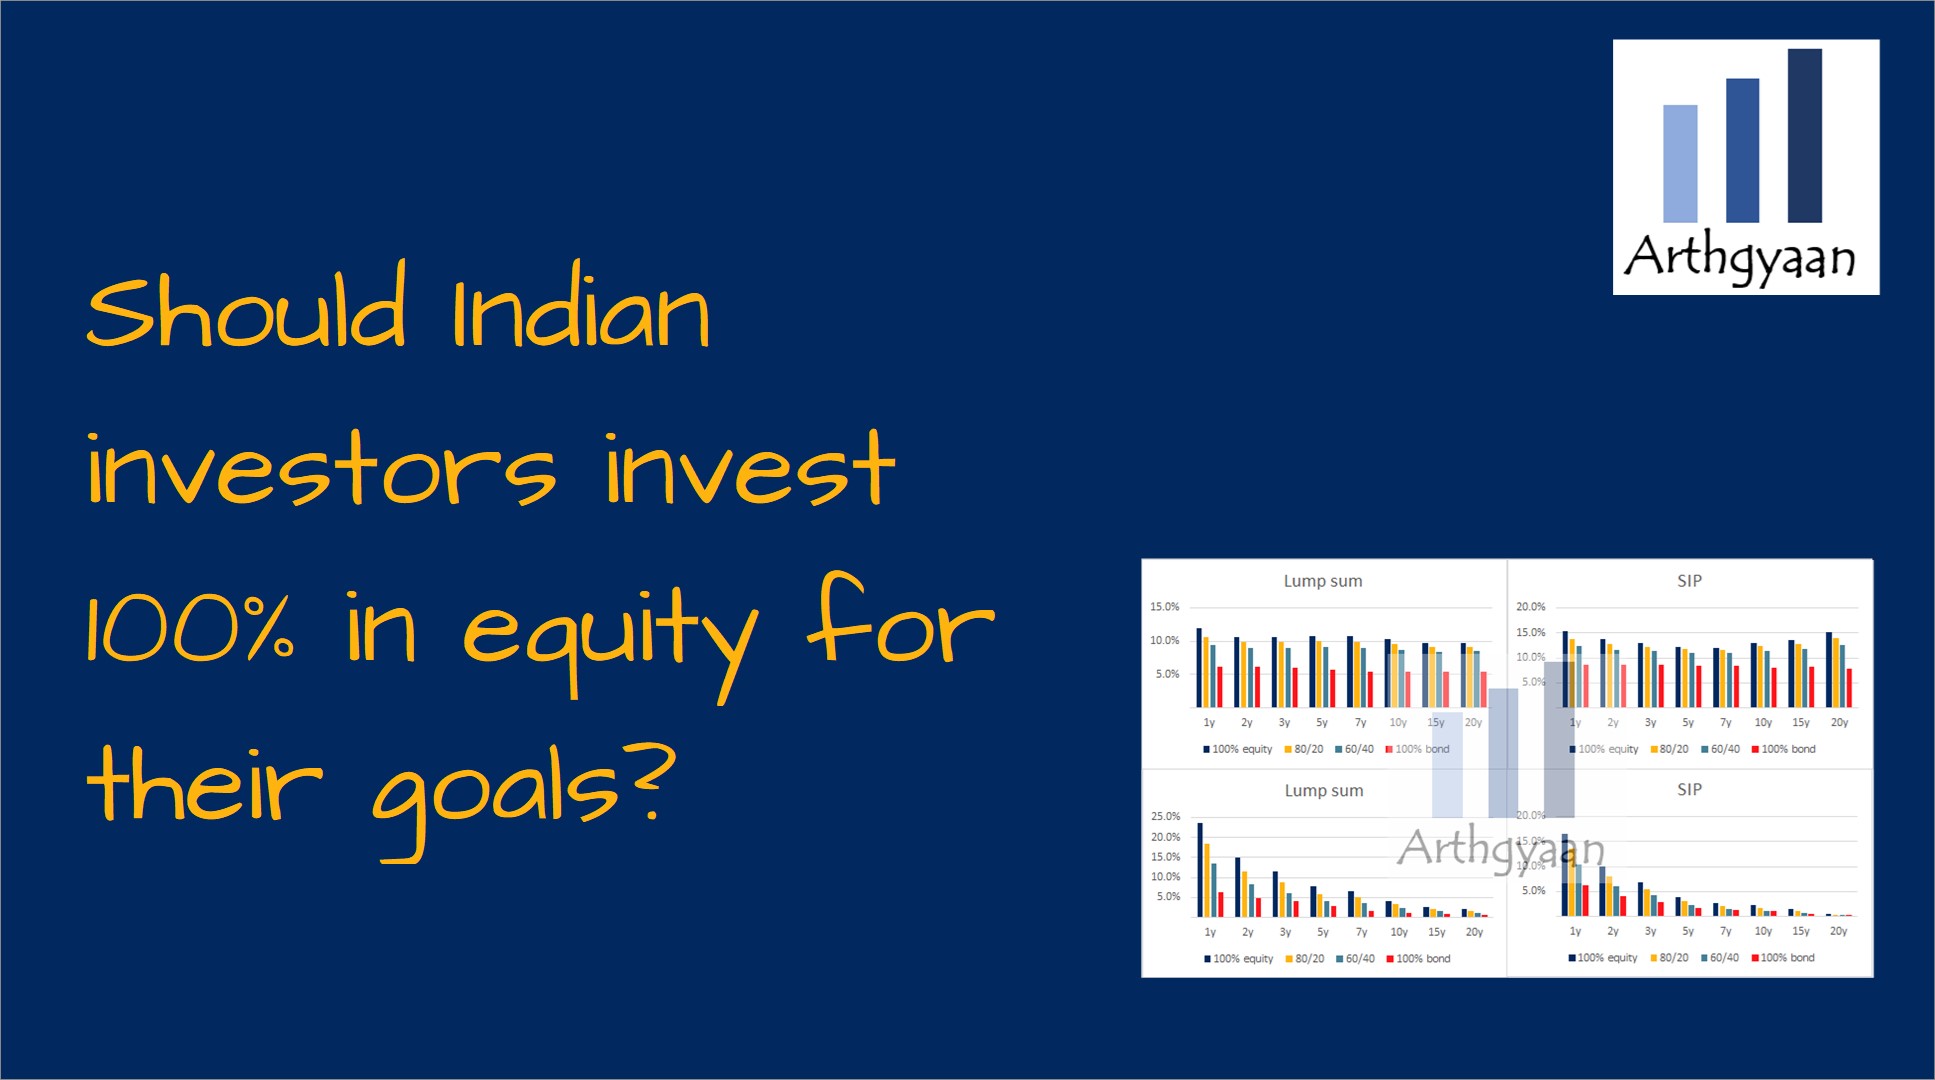
Many investors believe that they can get better returns by taking more risks. An excellent example of this behaviour is creating a 100% equity portfolio for investing instead of creating a mix of equity and debt assets in their portfolio.
In this article, the second of a series on asset allocation and performance, we will see how different portfolios where the asset allocation ranges from 100% equity on one side and 100% bonds on the other, along with 60:40 and 80:20 equity to debt have fared historically in India.
We have taken SENSEX TRI (Sensex Total Returns) data for equity and CCIL All Sovereign Bond data for debt and created four portfolios since Dec-1998 with the following asset allocations:
The mixed portfolios are rebalanced between equity and debt once a month. A good way to implement such a portfolio is by investing in a hybrid mutual fund with the proper target asset allocation.
You can read the first part here: How have different portfolios of stocks and bonds performed in India?.
In the sections below, we will show how these portfolios have performed for holding periods of 1 year to 20 years for both lump sum and SIP investments. All the return figures in the charts are rolling returns.
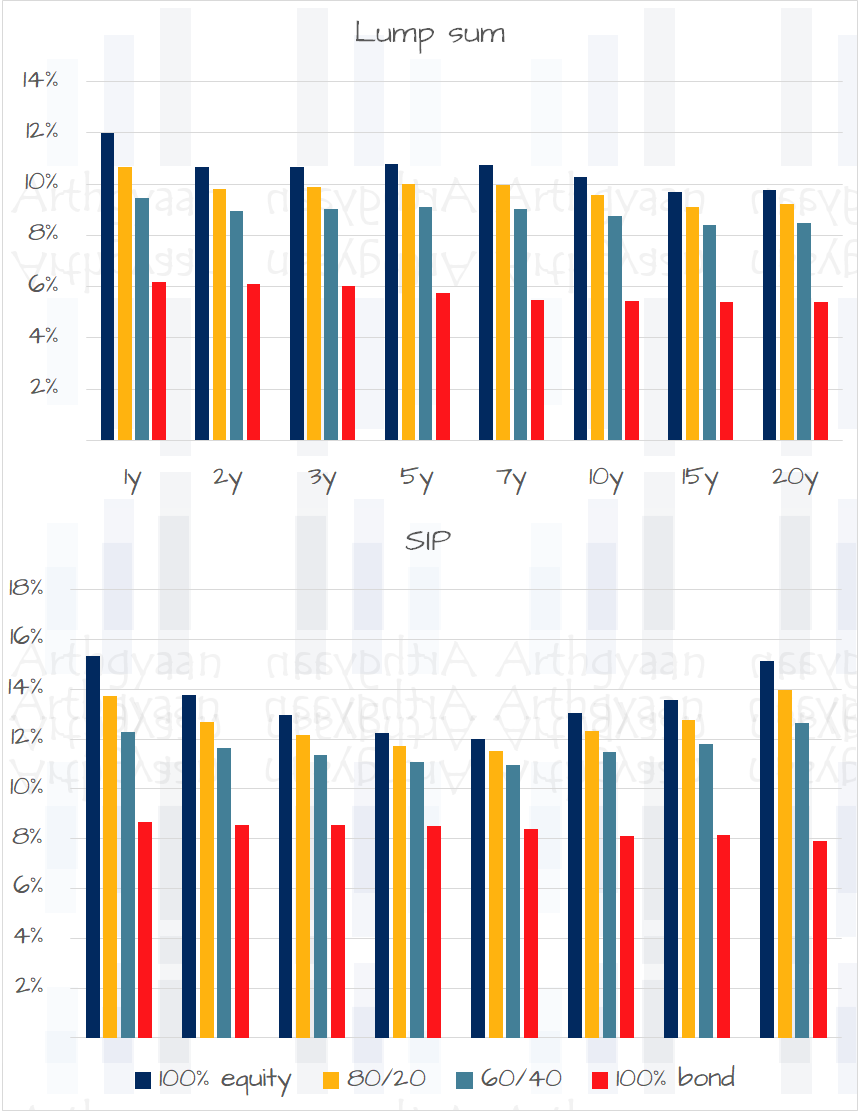
This chart shows the clear trend that the higher the equity allocation, the higher the average return - this result aligns with the common understanding that higher equity allocation leads to higher returns.
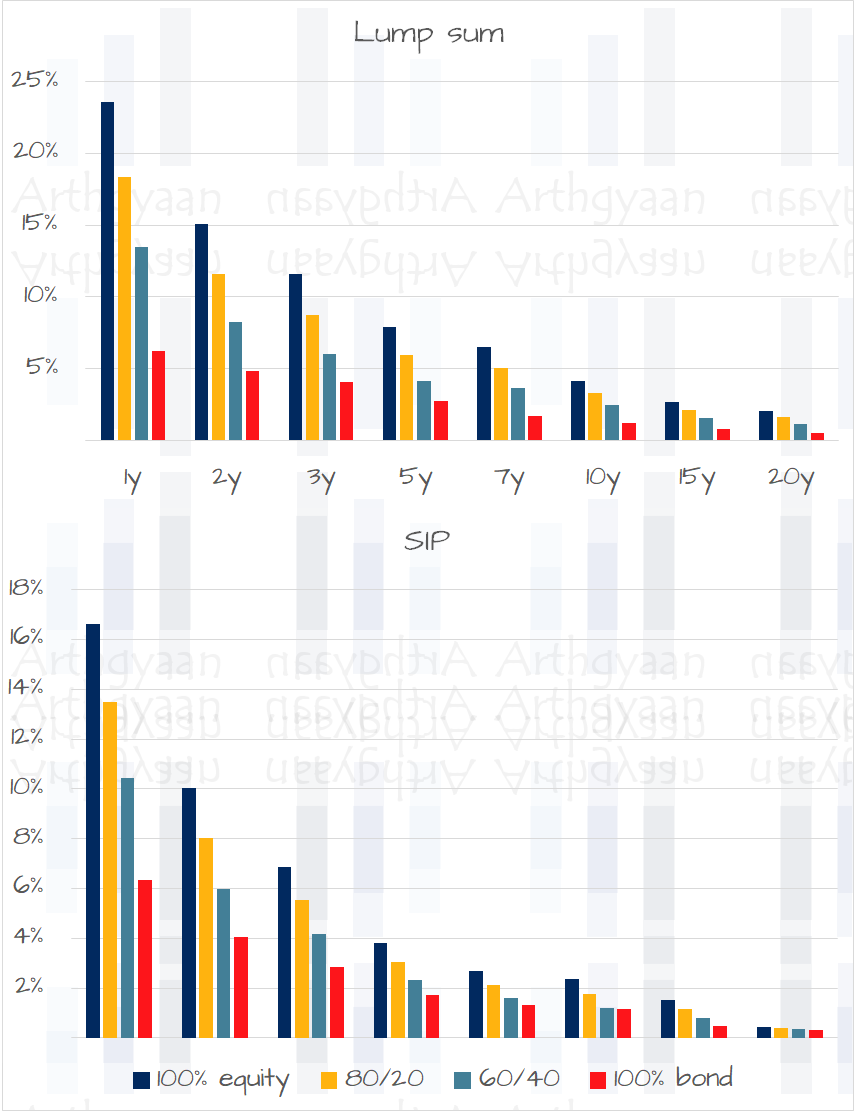
However, once we start looking at risk via the dispersion of the returns around the average in the previous section, a different picture emerges. There are two particular observations:
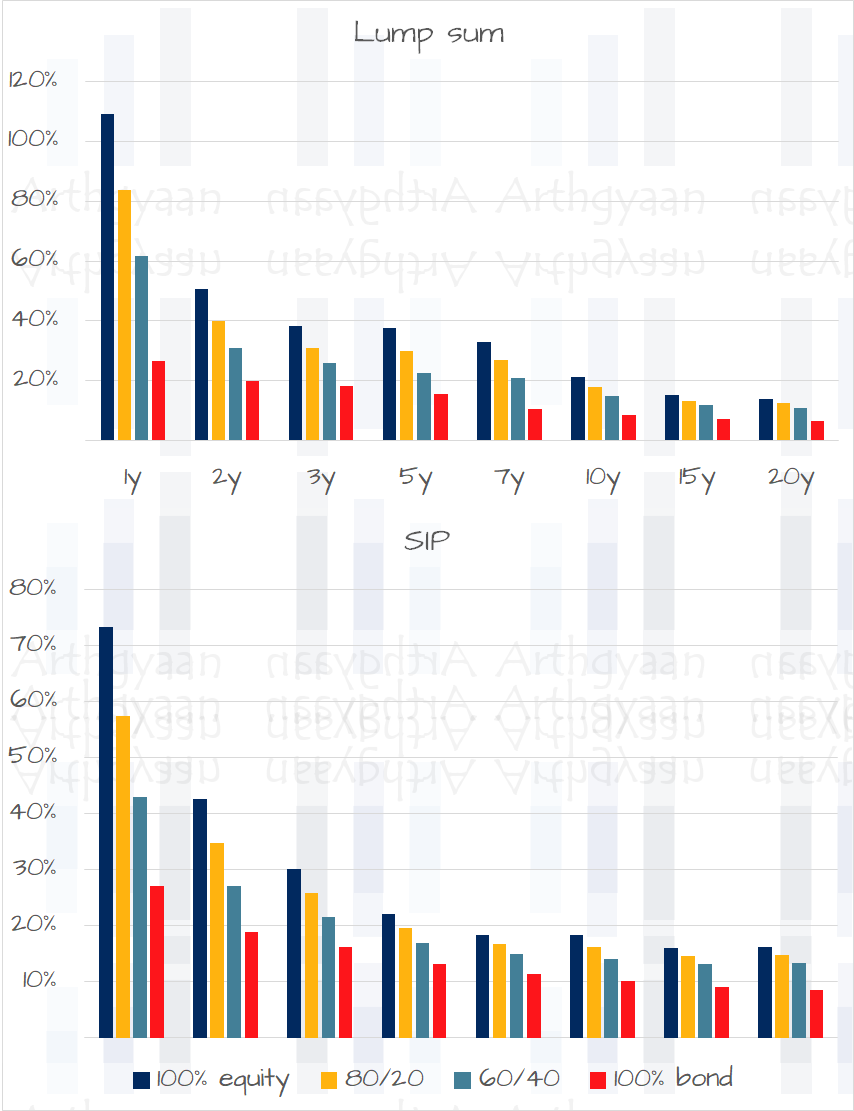
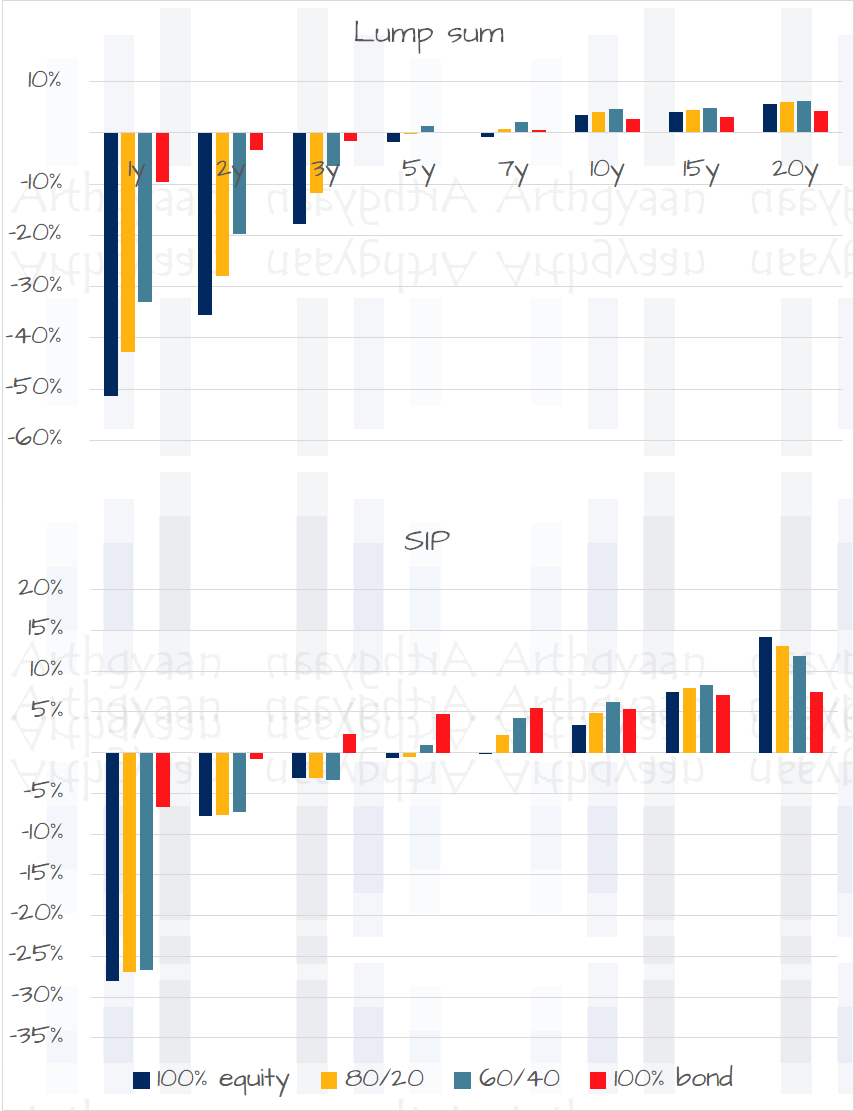
The role of risk, as measured by dispersion, is now clearly visible in the maximum and minimum figures. We can see profits only beyond 7 years of holding for both lump sum and SIP investments. Unsurprisingly, the worst returns are better with portfolios with an asset allocation with debt in the 7-20 year investment horizon cases for lump sum investments. This phenomenon demonstrates the power of risk management via rebalancing for the 60:40 portfolio. The same trend is seen for the investments in the SIP mode, except for the 20-year case where the pure equity portfolio has given the highest return in the worst case.
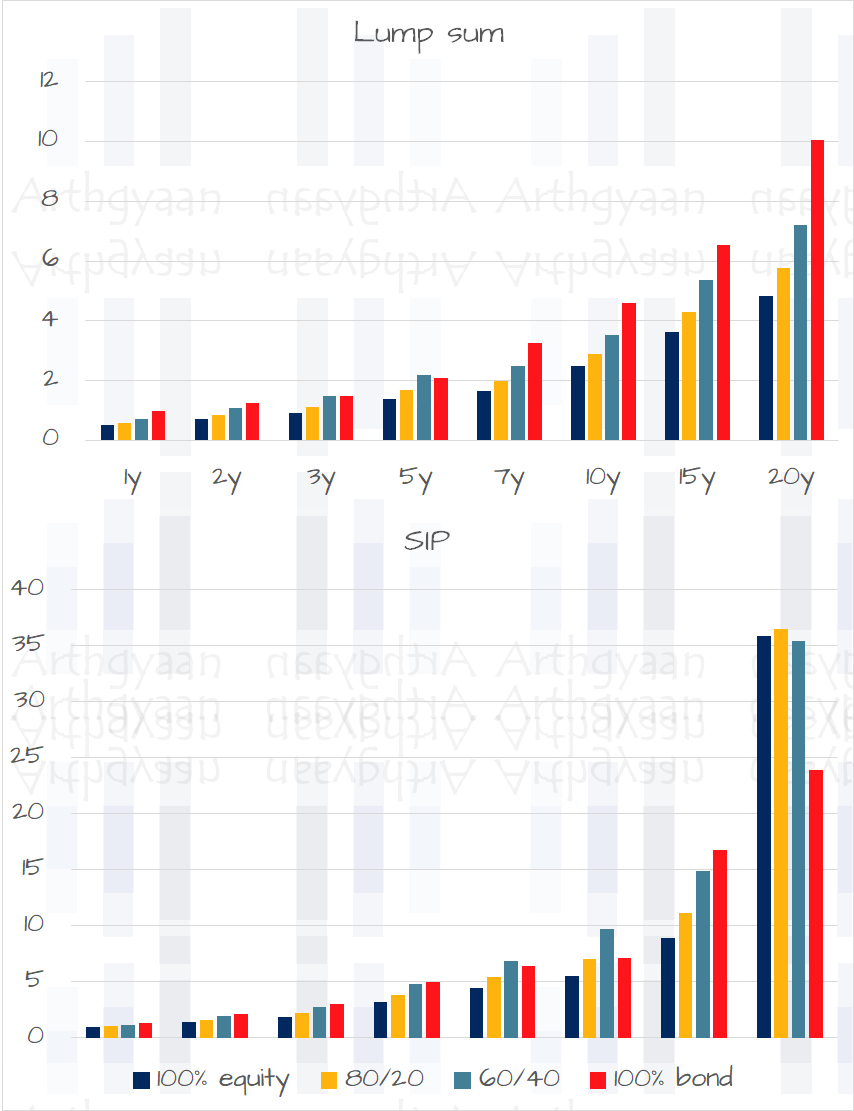
We will now see how the investments have performed when calculating return divided by risk for each case. Predictably, higher debt allocation leads to better risk-adjusted returns in all cases. However, we see one anomaly in the 20-year SIP portfolios where the pure debt portfolios have the lowest risk-adjusted returns. We will examine this case in more detail in a future article.
Investors should remember that the numbers in the charts are all based on historical data. In fact, if we see the actual dispersion for the portfolios, we will end up with a diagram like this:
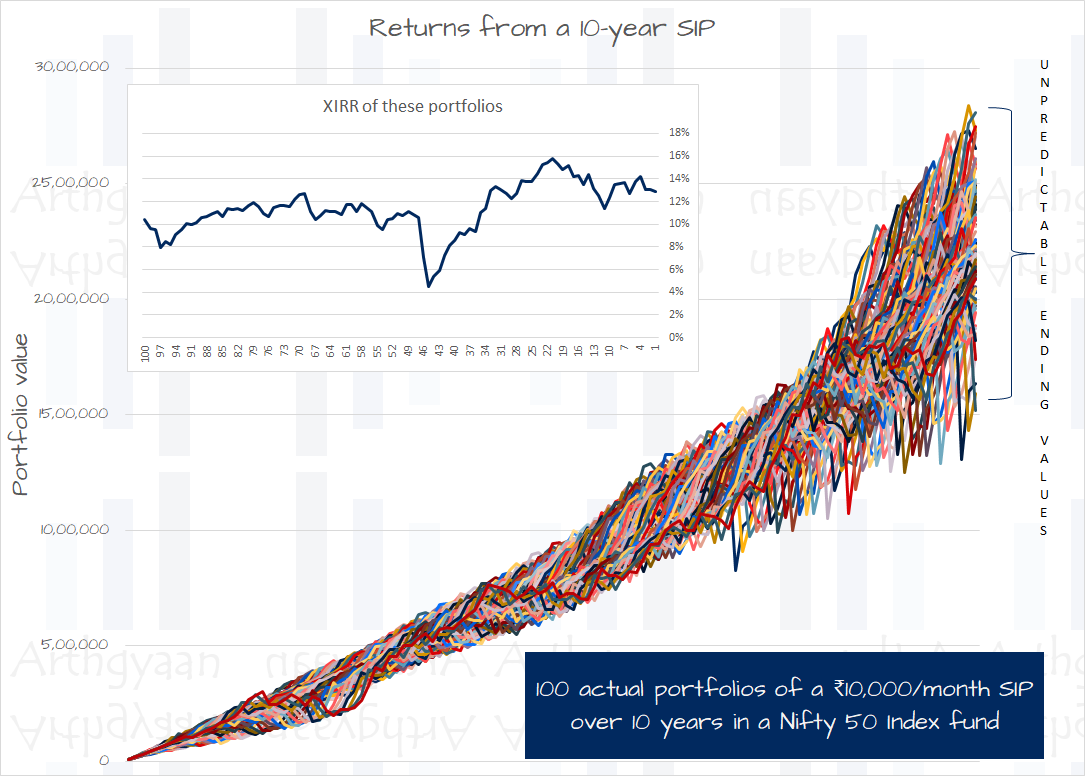
The above chart is from our viral article, The lie of wealth-creation via SIP in mutual funds, where we have shown that the result of a SIP is a random figure that cannot be known in advance.
Investors looking to start investing in equity for their goals should follow both proper asset allocation and a glide path for their investments.
We have shown above that shorter holding periods have a higher dispersion of returns compared to longer ones. The conclusion is that goals should implement a reducing equity glide path as the time horizon reduces via rebalancing.
An equity allocation above 60%, based on the risk profile of the investor, may be used at the starting point of long-term (more than 15 years) goals provided that the investor is aware of the risks involved and has the conviction of weathering the ups and downs.
1. Email me with any questions.
2. Use our goal-based investing template to prepare a financial plan for yourself.Don't forget to share this article on WhatsApp or Twitter or post this to Facebook.
Discuss this post with us via Facebook or get regular bite-sized updates on Twitter.
More posts...Disclaimer: Content on this site is for educational purpose only and is not financial advice. Nothing on this site should be construed as an offer or recommendation to buy/sell any financial product or service. Please consult a registered investment advisor before making any investments.
This post titled Should Indian investors invest 100% in equity for their goals? first appeared on 07 May 2023 at https://arthgyaan.com