How have different portfolios of stocks and bonds performed in India?
This article shows the historical performance of stocks and bonds in India since 1999 for different asset allocations.
This article shows the historical performance of stocks and bonds in India since 1999 for different asset allocations.
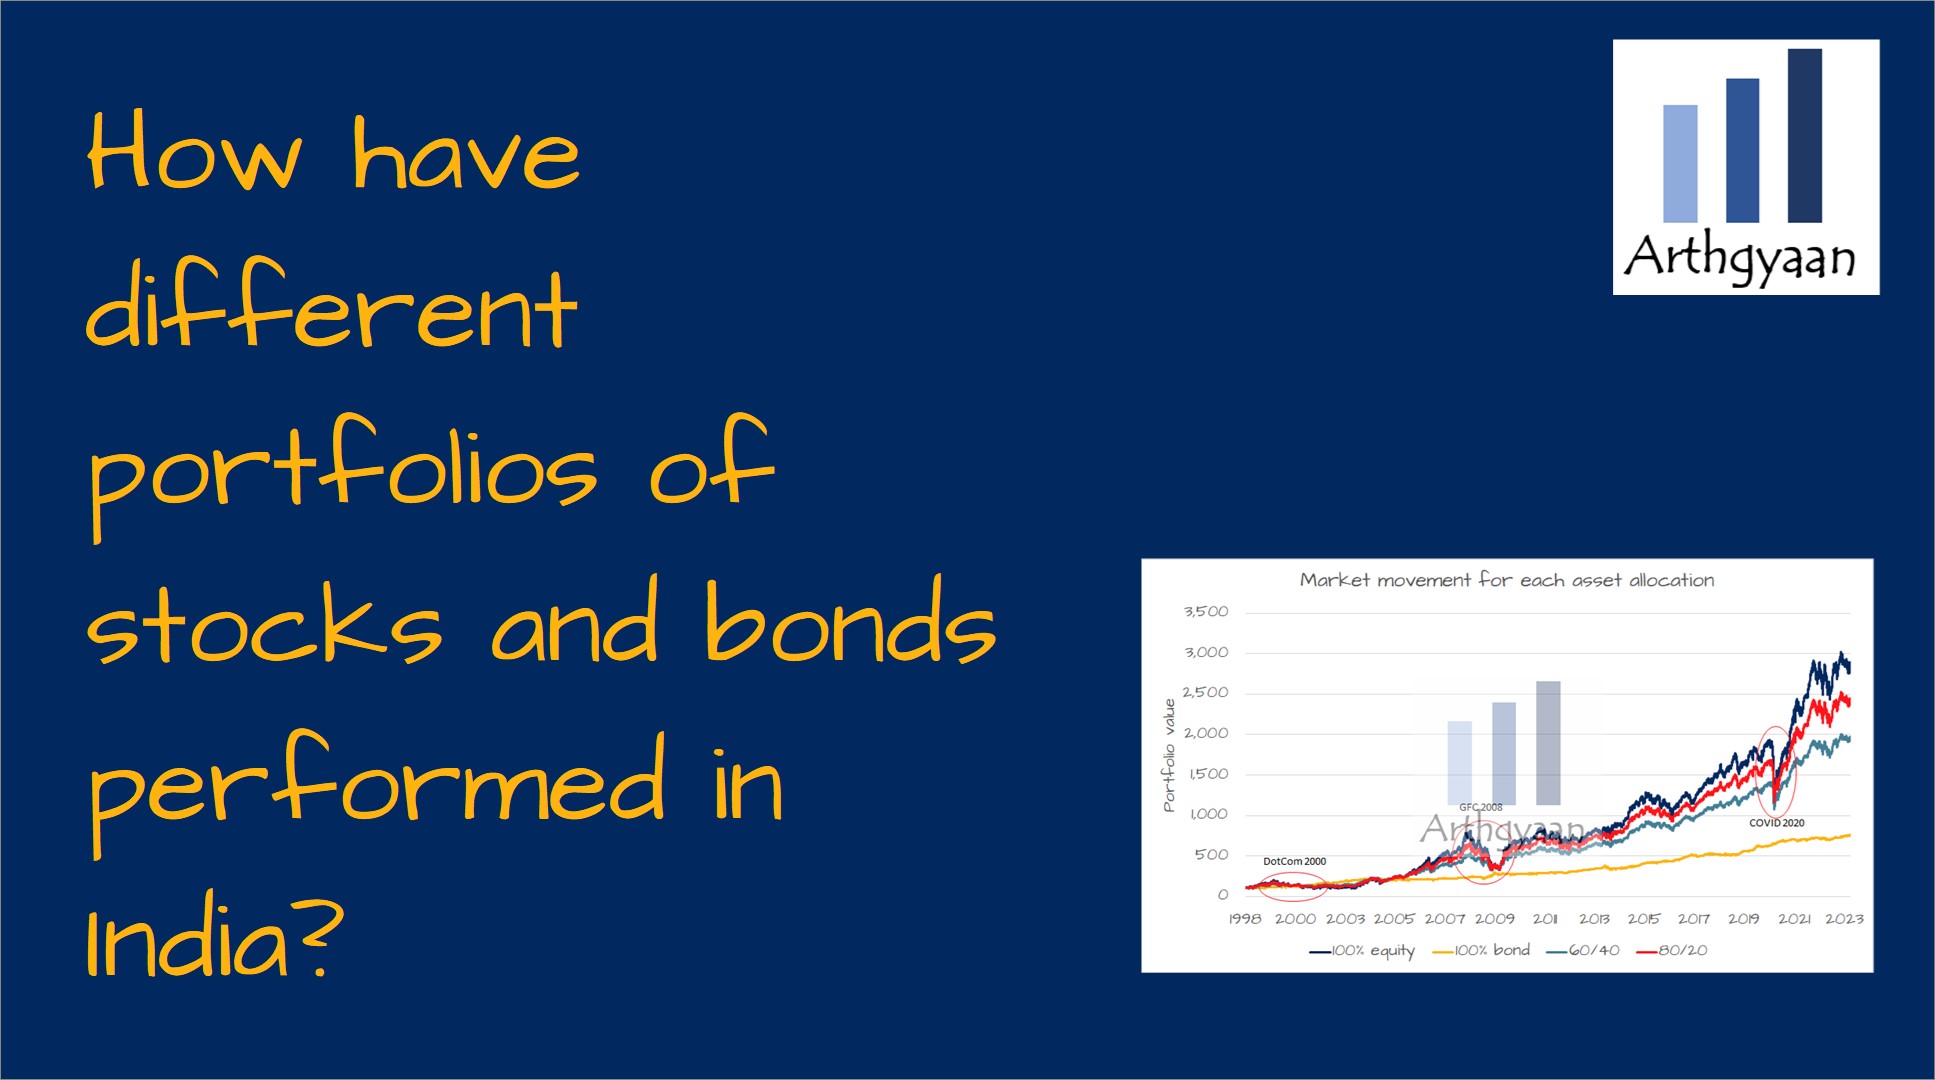
Many investors believe that they can get better returns by taking more risks. An excellent example of this behaviour is creating a 100% equity portfolio for investing instead of creating a mix of equity and debt assets in their portfolio.
In this article, the first of a series on asset allocation and performance, we will see how different portfolios where the asset allocation ranges from 100% equity on one side and 100% bonds on the other, along with 60:40 and 80:20 equity to debt have fared historically in India.
We have taken SENSEX TRI (Sensex Total Returns) data for equity and CCIL All Sovereign Bond data for debt and created four portfolios since Dec-1998 with the following asset allocations:
The mixed portfolios are rebalanced between equity and debt once a month. A good way to implement such a portfolio is by investing in a hybrid mutual fund with the proper target asset allocation.
You can read the second part here: Should Indian investors invest 100% in equity for their goals?.
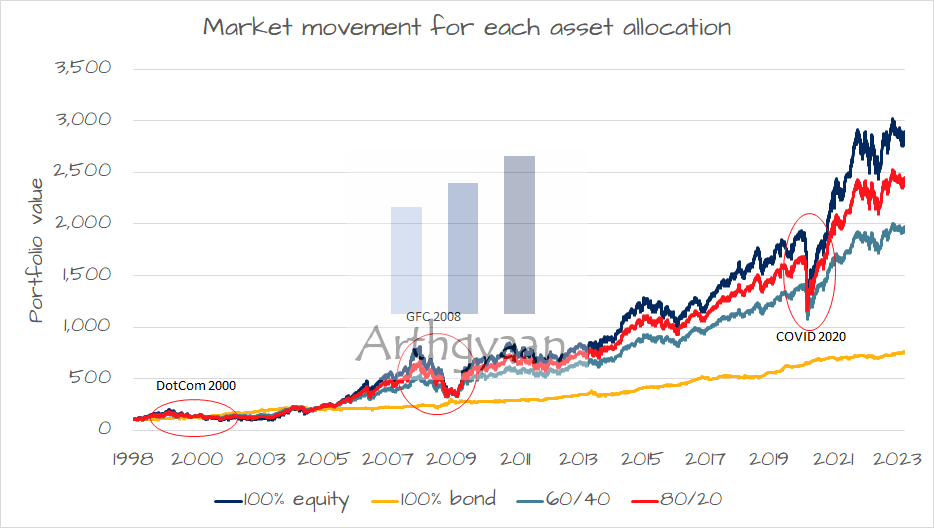
We have plotted the four portfolios with varying asset allocations since data availability in 1998. The 100% equity portfolio has predictably ended at the highest level. In comparison, the 100% bond portfolio has risen the least. The intermediation 80:20 and 60:40 portfolios have come between the two extremes.
We have also marked the largest falls in the capital markets since this period:
The chart shows that the 2000 DotCom bust had a minor fall vs the GFC 2008 vs the COVID-19 pandemic impact. However, that is misleading. Therefore, we will change the data’s appearance by switching to a logarithmic scale in the Y-Axis.
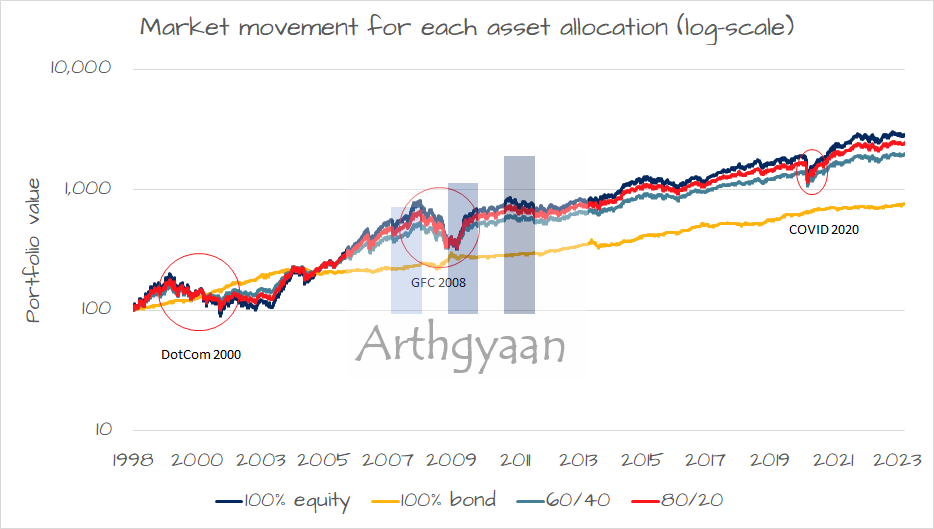
Once we switch to a logarithmic scale, the accurate picture emerges. Each equal movement in the Y-axis represents a 10x change in portfolio level. We see that the
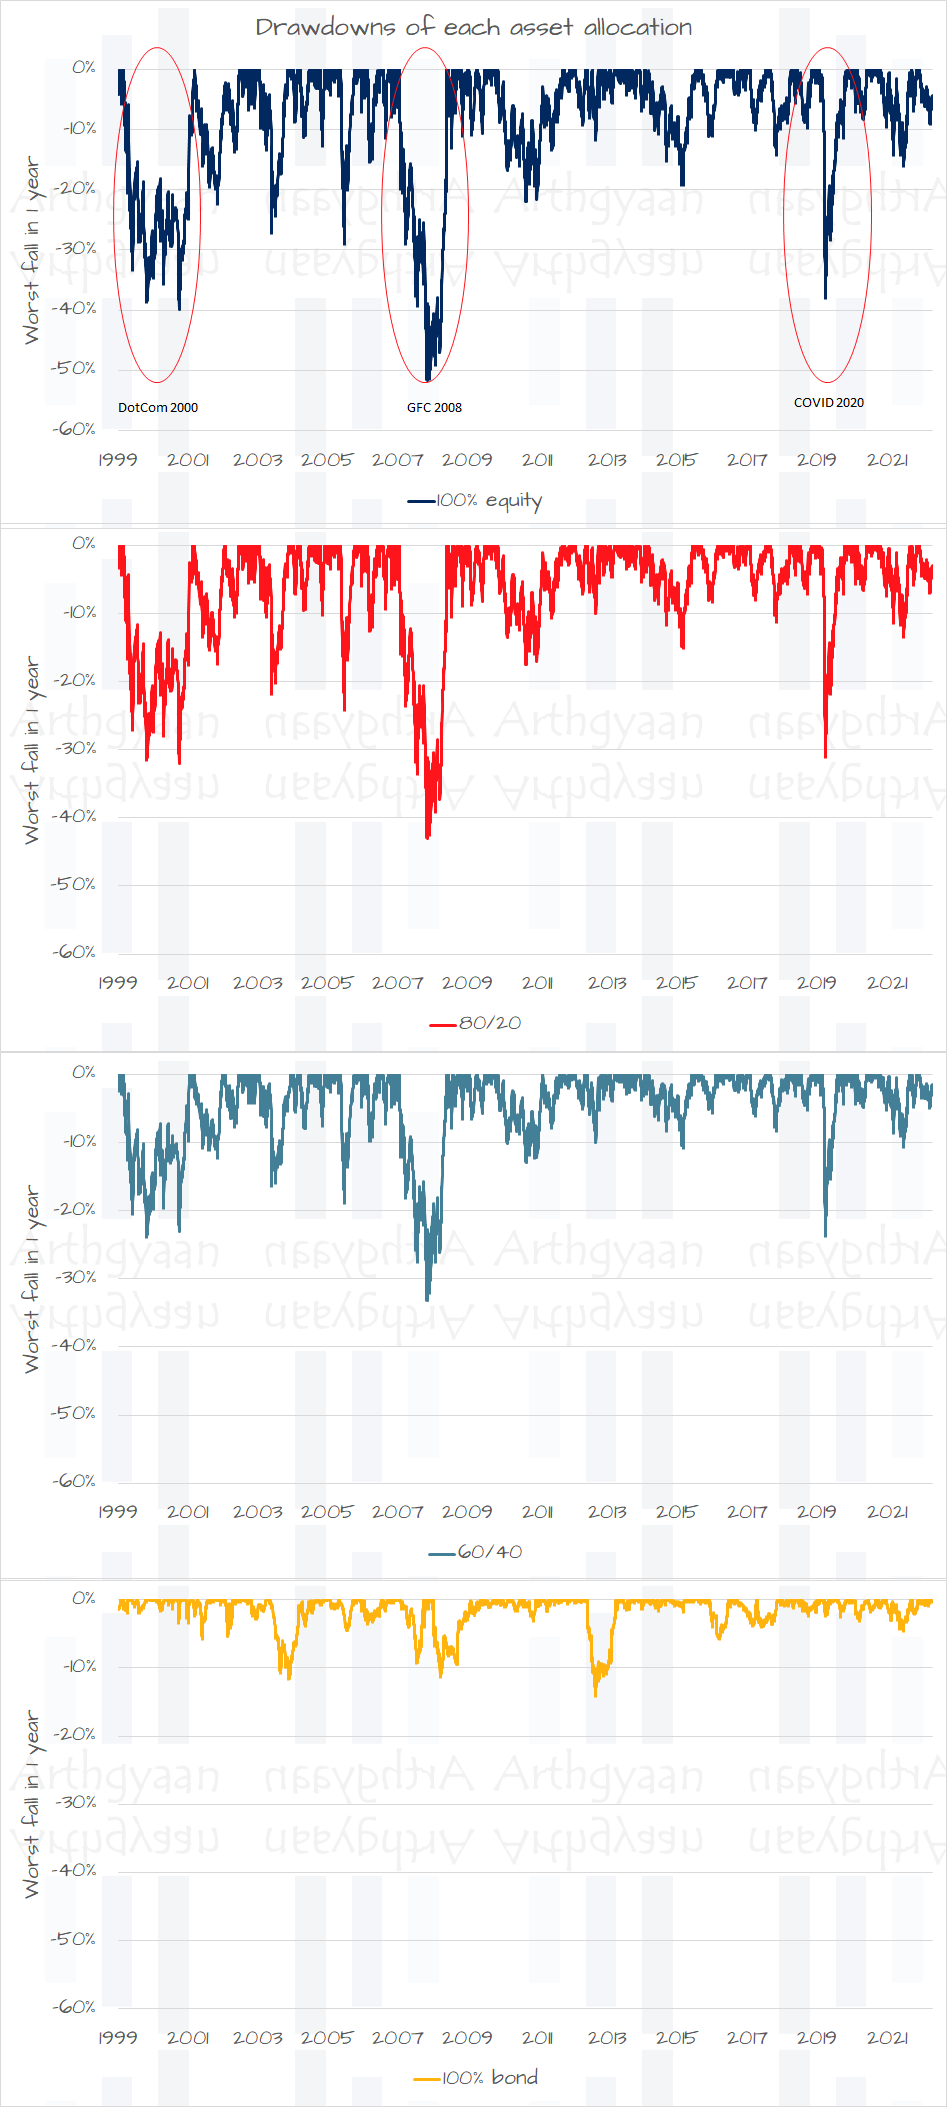
The point is that while the 100% equity portfolio has given the highest returns, the movement has been the most painful among all the alternatives. The following chart on these portfolios’ drawdown will clarify this point.
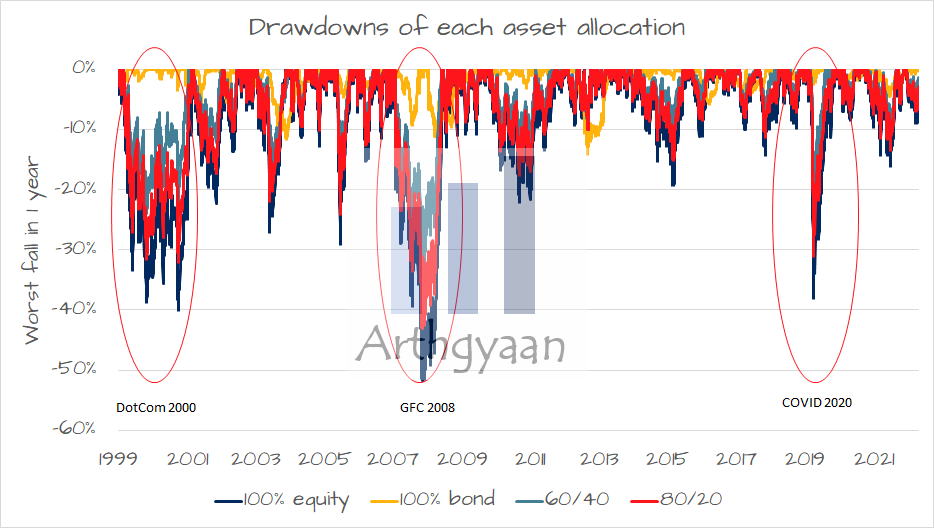
Drawdown is defined as the fall from a recent peak. The chart above shows the fall from a peak in the last year. We see the falls have been highest in the 100% equity portfolio and the lowest in the case of 100% bonds. The chart below breaks down each asset allocation separately to clarify the point.
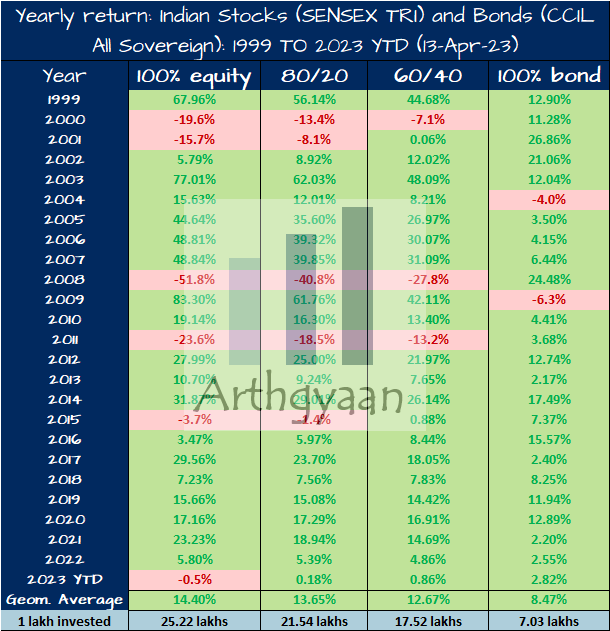
The table above shows how these four portfolios have performed every calendar year since 1999. We also see the average returns over this period and the growth of ₹1 lakh investment made at the beginning.
In a this article, we have covered the returns of lump sum and SIP investments across multiple holding periods for these portfolios.
Now we have a simpler set of model portfolio data here that you can refer here: Portfolio allocation models for Indian investors.
1. Email me with any questions.
2. Use our goal-based investing template to prepare a financial plan for yourself.Don't forget to share this article on WhatsApp or Twitter or post this to Facebook.
Discuss this post with us via Facebook or get regular bite-sized updates on Twitter.
More posts...Disclaimer: Content on this site is for educational purpose only and is not financial advice. Nothing on this site should be construed as an offer or recommendation to buy/sell any financial product or service. Please consult a registered investment advisor before making any investments.
This post titled How have different portfolios of stocks and bonds performed in India? first appeared on 23 Apr 2023 at https://arthgyaan.com