Portfolio allocation models for Indian investors
This article shows how different asset allocation models for Indian stock and bonds have performed over the years.
This article shows how different asset allocation models for Indian stock and bonds have performed over the years.

Disclaimer: This article replicates a methodology similar to Vanguard’s model portfolios found at https://investor.vanguard.com/investor-resources-education/education/model-portfolio-allocation. This article does not mention or recommend any investments.
The purpose of this article to give a high level overview of the return vs. risk trade-off in various equity vs. debt asset allocation models in the Indian stock and bond markets. We understand that this article is a deviation from our usual “easy to digest” content style but serious investors will benefit considerably from understanding the results of the analysis.
We are using data for the SENSEX TRI (Total Return Index which includes dividends) for equity and the CCIL All Sovereign Bonds Index for the bond allocation. The data is from 1998 till date and uses month-end index values for a lump sum investment. We rebalance once a year. Returns are calculated using the Geometric average of the annual returns. The Sharpe ratio calculation uses 7% as the risk-free rate.
Taxes and trading costs have not been considered in these calculations and will reduce portfolio returns. Depending on the implementation, there might be taxes due to dividends and interest income that will further reduce returns.
Investors must complete a risk profiling exercise, using a tool like the Arthgyaan risk-profiling tool, before investing in any portfolio from the list below.
None of the portfolios below are suitable for short-term goals (less than or equal to five years) since the debt component has long-term bonds with considerable duration risk: Gilt funds do not always go up in value. Should you invest in gilt funds?
Since we are using indices these portfolios are not investible directly. Tax-efficient investment options for these portfolios do exist and can be implemented appropriately under professional guidance.
To understand how these model portfolios can help you:
These portfolios are suitable for investors looking for regular income from their portfolios. We can see below that having a lot more bonds than stocks in the portfolio does reduce risk considerably., However, since the investment has long-term bonds, there is a considerable amount of duration risk which means that the portfolios with a highest amount of bonds do not necessarily give more number of years of positive returns. Investors looking for such portfolios should consider implementing them via bucket theory: How to construct buckets for your retirement portfolio?.
Balanced portfolios do not show a strong bias to either equity or debt and are suitable for investors focusing on long-term portfolio growth without taking on an excessive amount of risk. These portfolios are suitable for the accumulation phase of an investor with a stable source of income. Investors in retirement should move on to income portfolios as described here: How much equity should you have in your retirement portfolio?.
Growth portfolios are suitable for investors looking only for wealth maximisation along with the potential for larger drawdowns during stress periods like the 2008 Global Financial Crisis. As the proportion of equity increases in the portfolio, the risk increases fairly quickly.
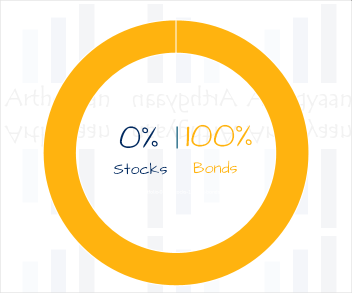
A portfolio of 0% stocks / 100% bonds in India has given an average return of 8.3% with a risk of 8.1% since 1998. The best year for this allocation is 2001 (+26.9%) while the worst year is 2009 (-6.3%). Using this allocation, 23 of 25 years has seen a profit
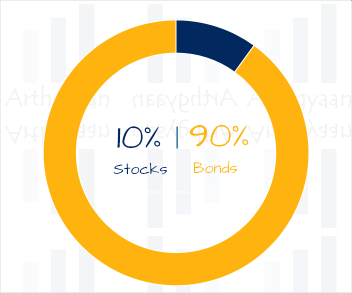
A portfolio of 10% stocks / 90% bonds in India has given an average return of 9.4% with a risk of 6.8% since 1998. The best year for this allocation is 2001 (+22.6%) while the worst year is 2004 (-2.0%). Using this allocation, 24 of 25 years has seen a profit
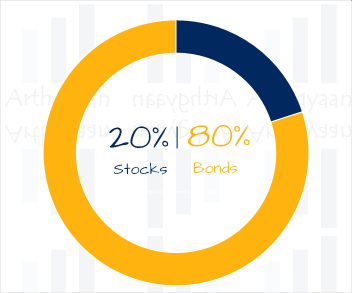
A portfolio of 20% stocks / 80% bonds in India has given an average return of 10.4% with a risk of 7.1% since 1998. The best year for this allocation is 2003 (+25.0%) while the worst year is 2011 (-1.8%). Using this allocation, 23 of 25 years has seen a profit
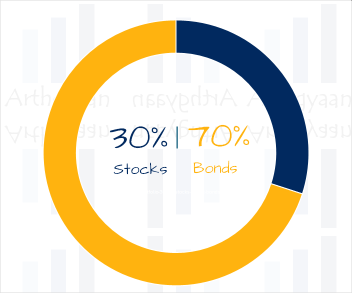
A portfolio of 30% stocks / 70% bonds in India has given an average return of 11.3% with a risk of 8.9% since 1998. The best year for this allocation is 2003 (+31.5%) while the worst year is 2011 (-4.5%). Using this allocation, 24 of 25 years has seen a profit
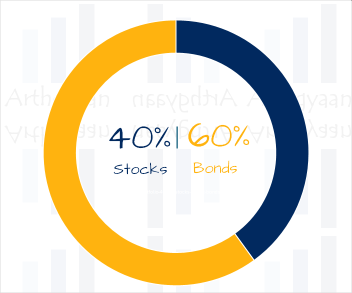
A portfolio of 40% stocks / 60% bonds in India has given an average return of 12.2% with a risk of 11.5% since 1998. The best year for this allocation is 2003 (+38.0%) while the worst year is 2011 (-7.2%). Using this allocation, 22 of 25 years has seen a profit
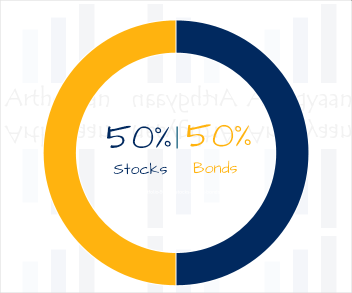
A portfolio of 50% stocks / 50% bonds in India has given an average return of 12.9% with a risk of 14.4% since 1998. The best year for this allocation is 2003 (+44.5%) while the worst year is 2008 (-13.7%). Using this allocation, 22 of 25 years has seen a profit
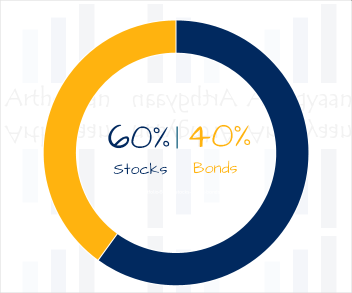
A portfolio of 60% stocks / 40% bonds in India has given an average return of 13.5% with a risk of 17.6% since 1998. The best year for this allocation is 2003 (+51.0%) while the worst year is 2008 (-21.3%). Using this allocation, 22 of 25 years has seen a profit
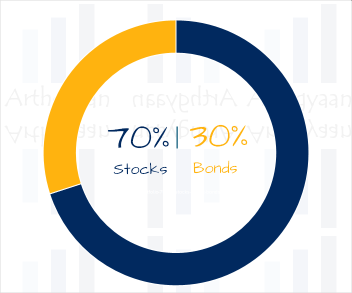
A portfolio of 70% stocks / 30% bonds in India has given an average return of 13.9% with a risk of 20.9% since 1998. The best year for this allocation is 2003 (+57.5%) while the worst year is 2008 (-28.9%). Using this allocation, 20 of 25 years has seen a profit
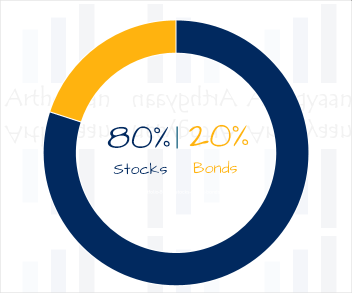
A portfolio of 80% stocks / 20% bonds in India has given an average return of 14.3% with a risk of 24.2% since 1998. The best year for this allocation is 2009 (+65.4%) while the worst year is 2008 (-36.5%). Using this allocation, 20 of 25 years has seen a profit
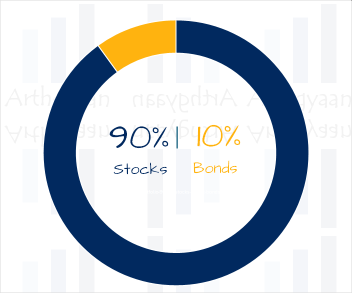
A portfolio of 90% stocks / 10% bonds in India has given an average return of 14.5% with a risk of 27.5% since 1998. The best year for this allocation is 2009 (+74.3%) while the worst year is 2008 (-44.2%). Using this allocation, 20 of 25 years has seen a profit
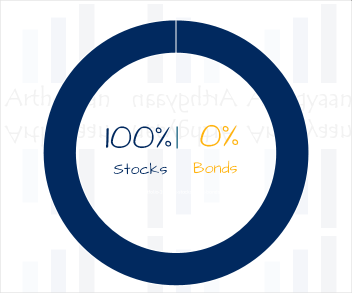
A portfolio of 100% stocks / 0% bonds in India has given an average return of 14.6% with a risk of 30.9% since 1998. The best year for this allocation is 2009 (+83.3%) while the worst year is 2008 (-51.8%). Using this allocation, 20 of 25 years has seen a profit


1. Email me with any questions.
2. Use our goal-based investing template to prepare a financial plan for yourself.Don't forget to share this article on WhatsApp or Twitter or post this to Facebook.
Discuss this post with us via Facebook or get regular bite-sized updates on Twitter.
More posts...Disclaimer: Content on this site is for educational purpose only and is not financial advice. Nothing on this site should be construed as an offer or recommendation to buy/sell any financial product or service. Please consult a registered investment advisor before making any investments.
This post titled Portfolio allocation models for Indian investors first appeared on 03 Feb 2024 at https://arthgyaan.com