The lie of wealth-creation via SIP in mutual funds
This article shows you that investing via SIP in a mutual fund does not create wealth.
This article shows you that investing via SIP in a mutual fund does not create wealth.

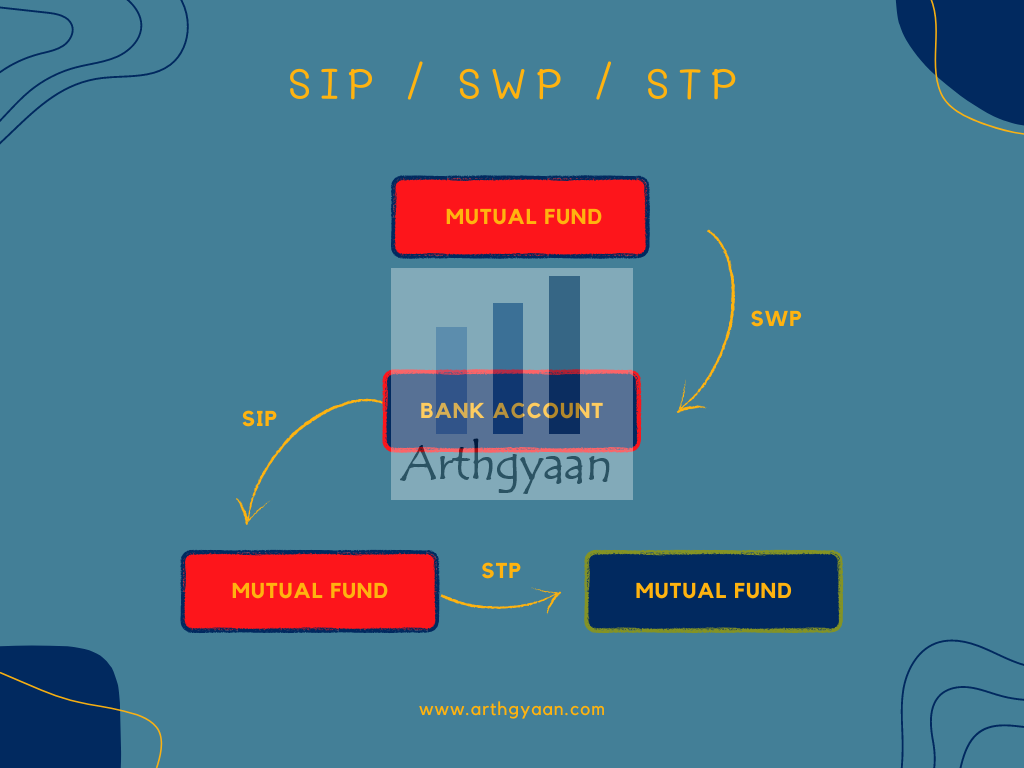
All of these are standing instructions that get executed as per a schedule you specify:
This article will show how having a SIP in a mutual fund may not necessarily guarantee that you will create wealth.
The followup article, about SWP when you are ready to draw down your portfolio is here: The lie of enjoying financial freedom via SWP from mutual funds
We have taken data for a Nifty 50 index fund since 2006 and calculated returns for multiple durations. The chart below shows this fund’s returns for a SIP for 1-year, 2-year, 3 years, 5-year, 10-year and 15-year durations. Unfortunately, since the data is from 2006 when daily NAVs became available, we do not have data for 20-year SIP in rolling form. We have taken NAV data from AMFI and calculated all possible SIP results for a 10-year investment period.
We invest once a month for 120 months and then value the portfolio after 120 months. We then roll the period by one day and recalculate. Since we started in 2006, there have been over 1600 such windows. These results are for a constant SIP. We will cover the results from a step-up SIP in a future article.
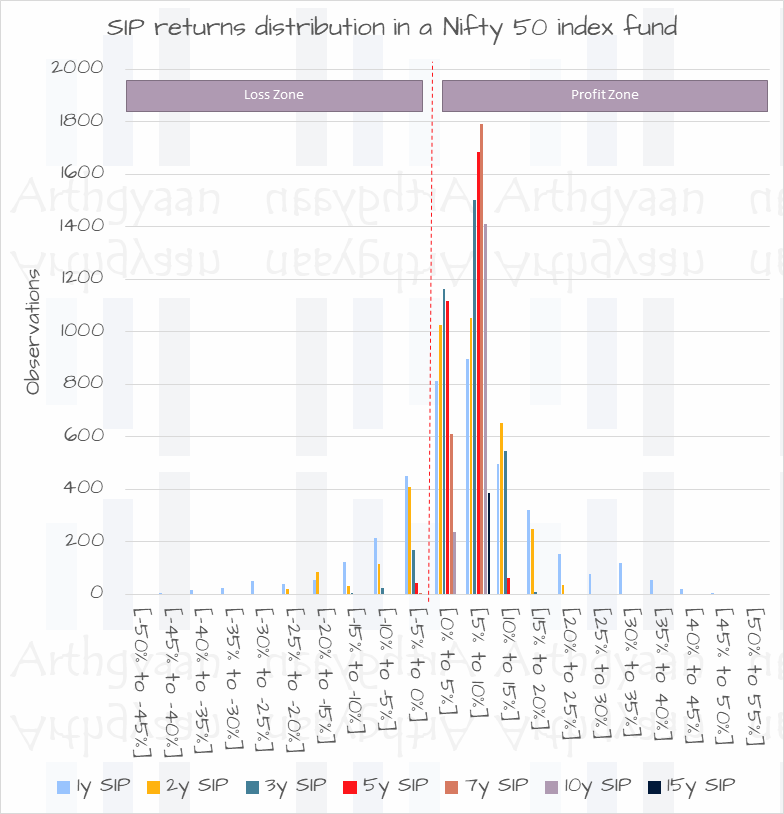
As the chart above shows, the more the investment period, the higher the chance of making a profit. However, just running a SIP in an equity fund does not mean you are building wealth. We will explain below.
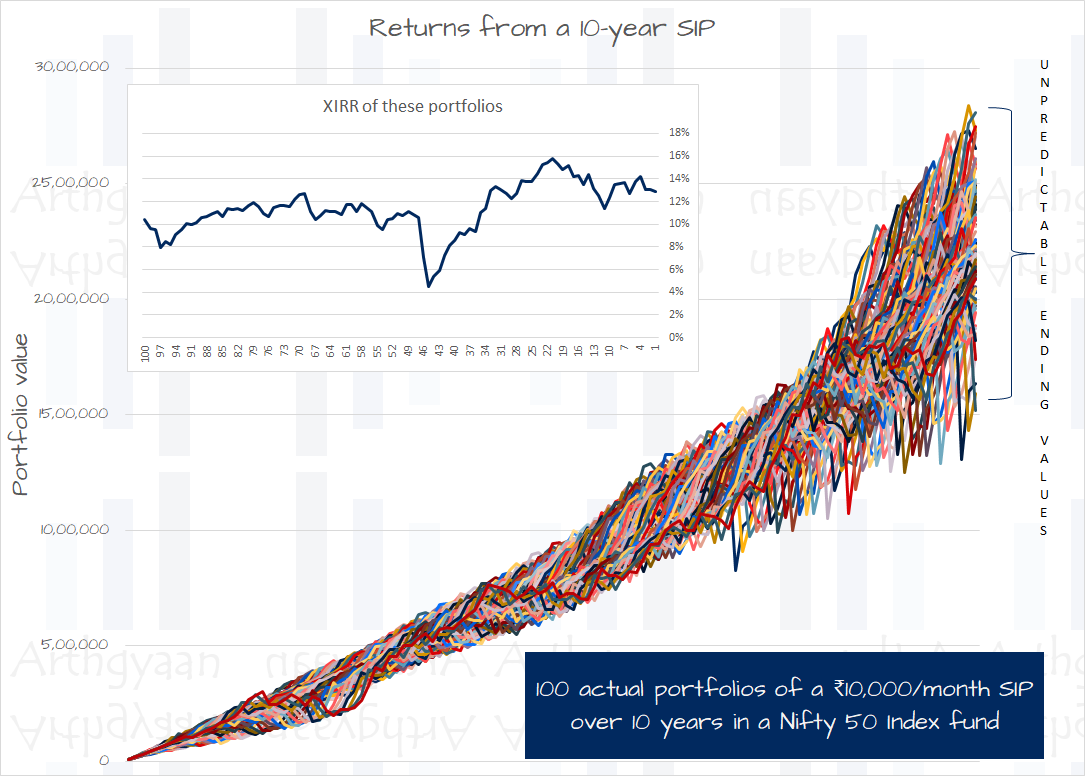
The chart shows 100 of these portfolios equally distributed from the 1600+ portfolios we calculated. However, as the chart shows, the ending values of the portfolio are entirely random, and there is a wide variation.
Since we are investing ₹10,000/month for 120 months, the amount invested is ₹12 lakhs, and the end portfolio value fluctuates from ₹15 lakhs and ₹28 lakhs.
Here is the crux of the problem. If we go by the narrative of
Start a SIP to create wealth
then all the 100 SIPs have created wealth. But the wealth amount after 10 years is unpredictable at the starting point.
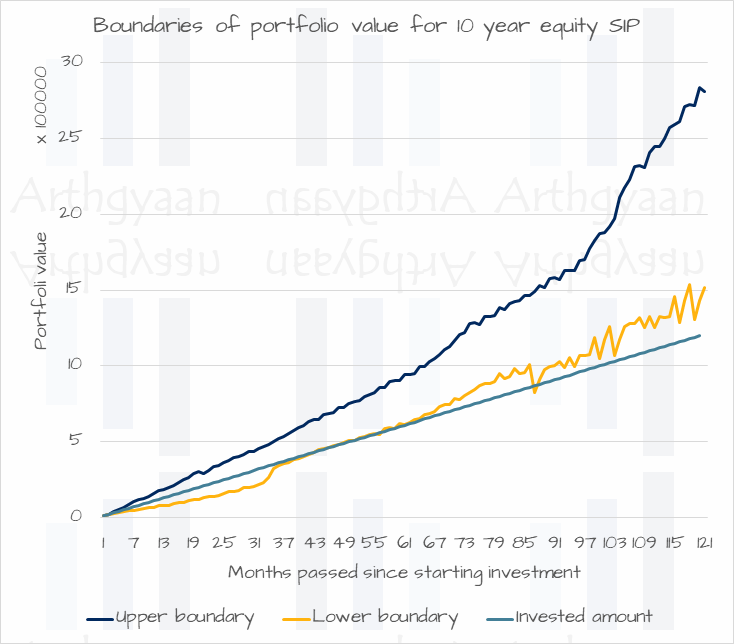
Imagine that you are investing for a child’s college goal with a ₹20 lakh target. Your final result varies between ₹15-28 lakhs. That is an unacceptable amount of variation. As the XIRR chart shows, the lowest-value portfolio that reached only ₹15 lakhs gave a return of only 4%. A recurring deposit or SIP in a debt mutual fund over 10 years would have given a similar return.
A bigger problem happens if the SIP is supposed to create a retirement corpus. Using the exact numbers, a ₹1 lakh/month SIP for 10 years would have made a corpus of ₹1.5-2.8 crores. The lifestyle that is sustainable with ₹1.5 crores is very different from that is possible with ₹2.8 crores.
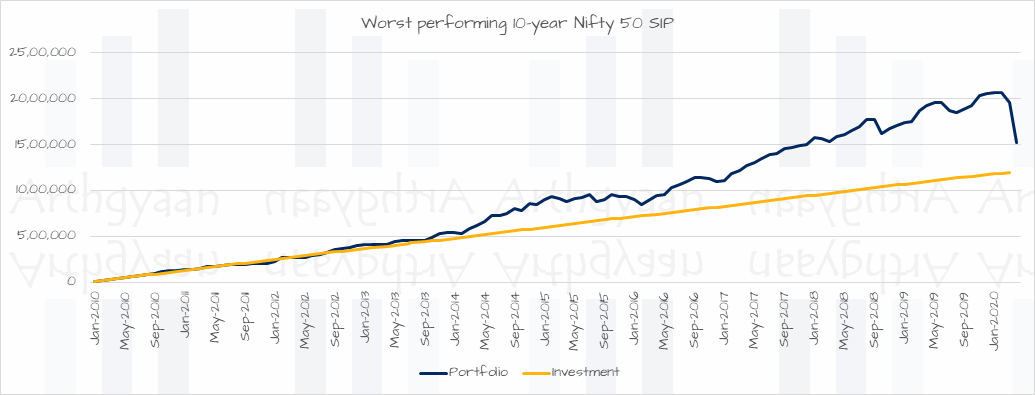
Predictably, the worst 10-year SIP with only 4% XIRR at ₹15 lakhs final value happened due to the COVID-19 pandemic. The investment period was from Jan-2010 and ended in Mar-2020.
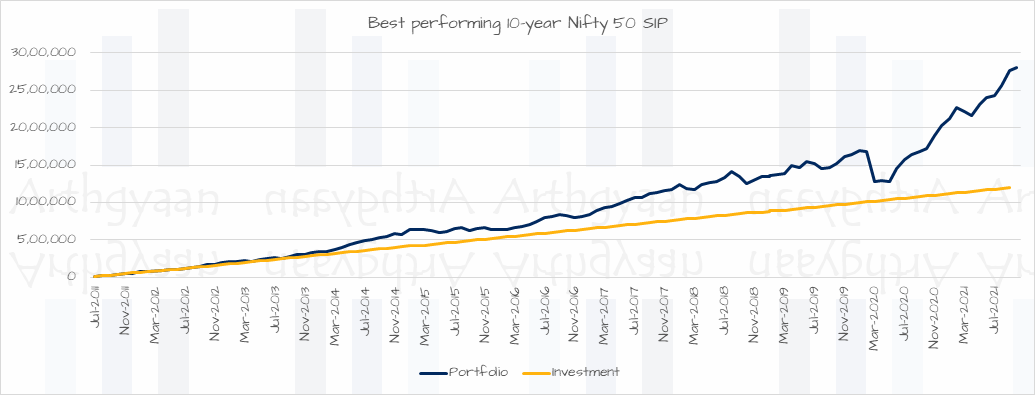
The best-performing SIP with a 16% XIRR and ₹28 lakhs final value was started in Jul-2011 and ended in Jun-2021. As the result shows, just a variation of a few months for starting date led to a drastically different ending value.
This result shows that running a SIP in an equity mutual fund may or may not create wealth. If the end result is uncertain, then the process does not work. So if you are investing in the hope of “wealth-creation”, that may stay in the realm of wishful thinking.
We have additional data for other holding periods in this article: Should Indian investors invest 100% in equity for their goals?.
When you start investing, instead of fixing on a return in mind say 12% which is not under your control, start with a corpus figure that you want to reach: Why you should chase your target goal corpus instead of returns
That corpus will be used to pay for a known goal in the future:
Ask yourself these questions
Published: 23 December 2025
6 MIN READ

Published: 18 December 2025
8 MIN READ
1. Email me with any questions.
2. Use our goal-based investing template to prepare a financial plan for yourself.Don't forget to share this article on WhatsApp or Twitter or post this to Facebook.
Discuss this post with us via Facebook or get regular bite-sized updates on Twitter.
More posts...Disclaimer: Content on this site is for educational purpose only and is not financial advice. Nothing on this site should be construed as an offer or recommendation to buy/sell any financial product or service. Please consult a registered investment advisor before making any investments.
This post titled The lie of wealth-creation via SIP in mutual funds first appeared on 12 Feb 2023 at https://arthgyaan.com