Arthgyaan

Supporting everyone's personal finance journey

What are the rolling returns of SIP and lump sum of direct mutual funds? (July 2024 edition)

This article provides a list of fund and category-wise statistics of rolling return of SIP and lump sum investments for various mutual funds.

What are the rolling returns of SIP and lump sum of direct mutual funds? (July 2024 edition)


Posted on 03 Jul 2024
Author: Sayan Sircar
4 mins read
๐Ÿ“ขJoin 3300+ readers on WhatsApp and get new post notifications!

This article provides a list of fund and category-wise statistics of rolling return of SIP and lump sum investments for various mutual funds.

What are the rolling returns of SIP and lump sum of direct mutual funds? (July 2024 edition)

๐Ÿ“š Topics covered:

What are rolling returns of a mutual fund?

Rolling returns are all of the returns that the fund gave for a particular investment period. If, for example, we wish to understand how much returns the fund usually gave for a 10Y lump sum investment, we can list down in a table or chart returns like this:

  • invested on 1st Jan 2006 and sold on 1st Jan 2016 after 10 years and got a return of X%
  • invested on 2nd Jan 2006 and sold on 2nd Jan 2016 after 10 years and got a return of Y%
  • invested on 3rd Jan 2006 and sold on 3rd Jan 2016 after 10 years and got a return of Z%

and so on. This sequence of returns [X,Y,Z] is a time series like this:

Ending date Type Return
01-Jan-16 10Y lump sum X%
02-Jan-16 10Y lump sum Y%
03-Jan-16 10Y lump sum Z%

With this time-series, you can plot a graph, calculate metrics like average, max, min, median etc.

For example, we have calculated metrics like

  • average = (X+Y+Z)/3 etc. (called mean)
  • standard deviation = square root of the average of (X-mean)^2,(Y-mean)^2,(Z-mean)^2
  • median = middle value of the sorted set X,Y,Z (gives a โ€œtruerโ€ average by avoiding extreme values)
  • max and min = extreme values of the set
  • return per unit risk = AVERAGE/standard deviation
  • Sharpe Ratio = (average - 7%)/standard deviation, assuming 7% is the risk-free rate that you will anyway get from safe investments

The statistical terms used in this article are explained here: Which are the common statistical terms used in Investing?

In this article, we will show the rolling metrics of various mutual funds:

  • investment period: 1Y, 2Y, 3Y, 5Y, etc.
  • type: lump sum, SIP (fixed), SIP (10% step-up)
  • data since: 1st Jan 2013 (this is the date when direct funds were launched in India)
  • categories: equity, debt, and hybrid
  • only DIRECT and GROWTH plans
  • all mutual funds active on the publishing date as per AMFI data and classification

What should you keep in mind when using this data for analysis purpose?

Rolling Mutual Fund Return Dataset

  • The reader is expected to draw their own conclusions from the data
  • There is no implication of the data being complete, accurate or timely
  • This data is provided as-is without any warranties, implied or otherwise
  • The data, when calculating statistical measures like average, excludes data points above and below 2 standard-deviations from the mean. This means that both maximum and minimum numbers are higher in real life than in this data-set while retaining around 95% of the actual numbers

Did you know that we have a private Facebook group which you can join for free and ask your own questions? Please click the button below to join.

Also read
Which tax regime is better if you want to invest in PPF or ELSS or have a home loan?

How to interpret the data in the data-set of rolling XIRR?

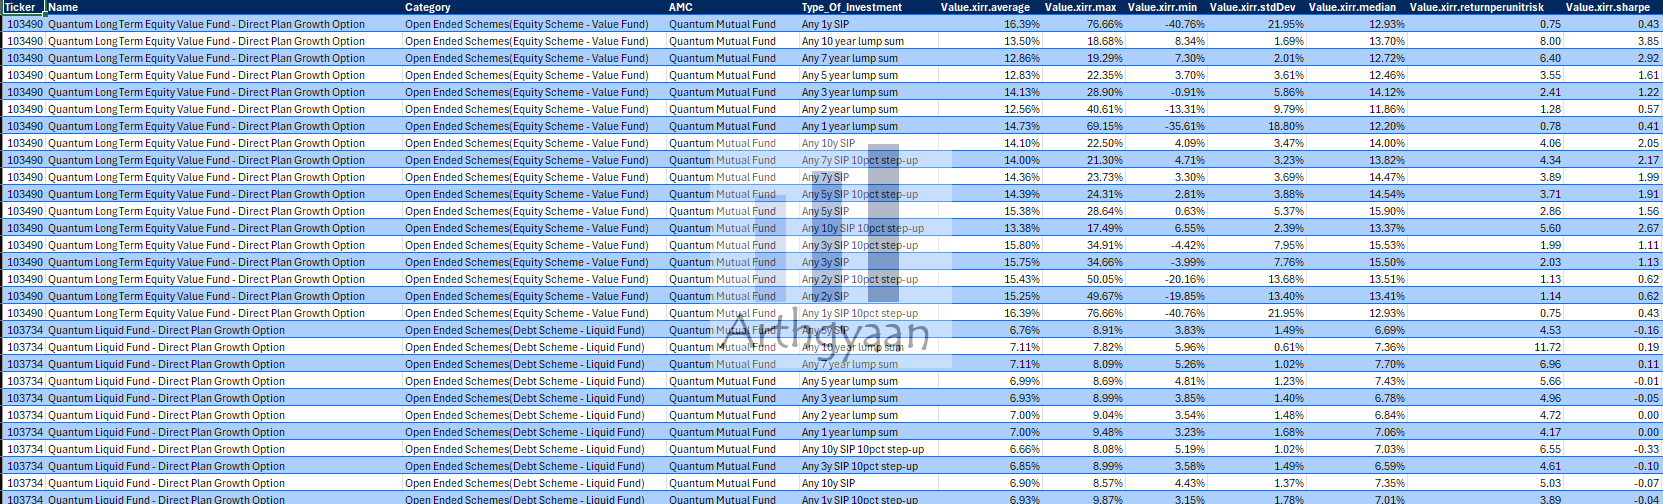
These are the column headers of in the file:

Field Meaning
Ticker Fund id from www.amfiindia.com
Name Name of fund
Category AMFI category of the fund
AMC AMC which runs the fund
Type_Of_Investment Investment type
Value.xirr.average Average of the XIRR numbers
Value.xirr.max Max
Value.xirr.min Min
Value.xirr.stdDev Standard Deviation
Value.xirr.median Median
Value.xirr.returnperunitrisk Average/StdDev
Value.xirr.sharpe Sharpe Ratio
bv Investment amount
Value.mv.average Average of the final pre-tax amount
Value.mv.max Max
Value.mv.min Min
Value.mv.stdDev Standard Deviation
Value.mv.median Median

Where to get free rolling-data XIRR for mutual fund returns?

There are no charges for downloading this data. You can download the full data-set here

What's next? You can join the Arthgyaan WhatsApp community

You can stay updated on our latest content and learn about our webinars. Our community is fully private so that no one, other than the admin, can see your name or number. Also, we will not spam you.

For resident Indians ๐Ÿ‡ฎ๐Ÿ‡ณ:


For NRIs ๐Ÿ‡บ๐Ÿ‡ธ๐Ÿ‡ฌ๐Ÿ‡ง๐Ÿ‡ช๐Ÿ‡บ๐Ÿ‡ฆ๐Ÿ‡บ๐Ÿ‡ฆ๐Ÿ‡ช๐Ÿ‡ธ๐Ÿ‡ฌ:


Share on WhatsApp:

To understand how this article can help you:

If you have a comment or question about this article

The following button will open a form with the link of this page populated for context:

If you liked this article, please leave us a rating

The following button will take you to Trustpilot:

Discover an article from the archives

Previous and next articles:


Latest articles:


Topics you will like:


Next steps:

1. Email me with any questions.

2. Use our goal-based investing template to prepare a financial plan for yourself.

Don't forget to share this article on WhatsApp or Twitter or post this to Facebook.

Discuss this post with us via Facebook or get regular bite-sized updates on Twitter.

More posts...

Disclaimer: Content on this site is for educational purpose only and is not financial advice. Nothing on this site should be construed as an offer or recommendation to buy/sell any financial product or service. Please consult a registered investment advisor before making any investments.

This post titled What are the rolling returns of SIP and lump sum of direct mutual funds? (July 2024 edition) first appeared on 03 Jul 2024 at https://arthgyaan.com


We are currently at 482 posts and growing fast. Search this site:
Copyright ยฉ 2021-2024 Arthgyaan.com. All rights reserved.