How much Long-Term Wealth has been Built with Equity Investing in the US Stock Market?
This article explores how much return has come from the US stock market using data from the 1870s.
 Research
This article explores how much return has come from the US stock market using data from the 1870s.

The US stock markets is one of the oldest stock markets in the world with two important characteristics:
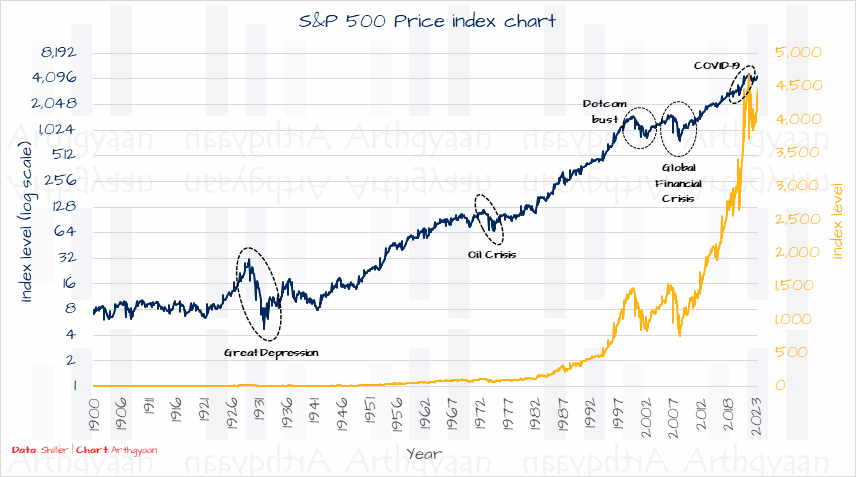
For this analysis, we have used data from Prof. Robert Shiller’s website for historical index return. We have data from the 1870s and are using the S&P 500 index, which represents the largest 500 US companies, as a proxy for the US stock market. In all the charts and tables below, we have adjusted the index price returns with dividends and so these are S&P 500 total index returns. We have not adjusted for inflation.
The charts show the same data but we have used a logarithmic scale for the blue graph since the linear scale, in yellow, looks flat for most of the period and will hide the price movement in the early periods.
Average, max and min returns
| Metric | Average | StdDev | Median | Minimum | Maximum |
|---|---|---|---|---|---|
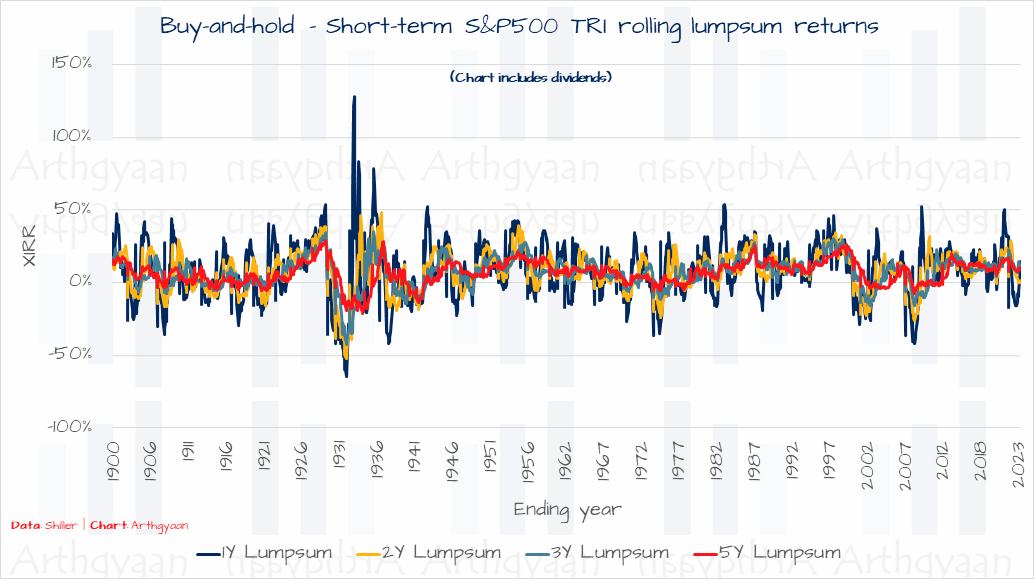
| Any 1Y period | 8.2% | 19.3% | 9.4% | (-64.8%) | 127.7% |
| Any 2Y period | 7.3% | 13.3% | 8.0% | (-52.1%) | 48.0% |
| Any 3Y period | 7.0% | 10.4% | 8.0% | (-43.1%) | 34.9% |
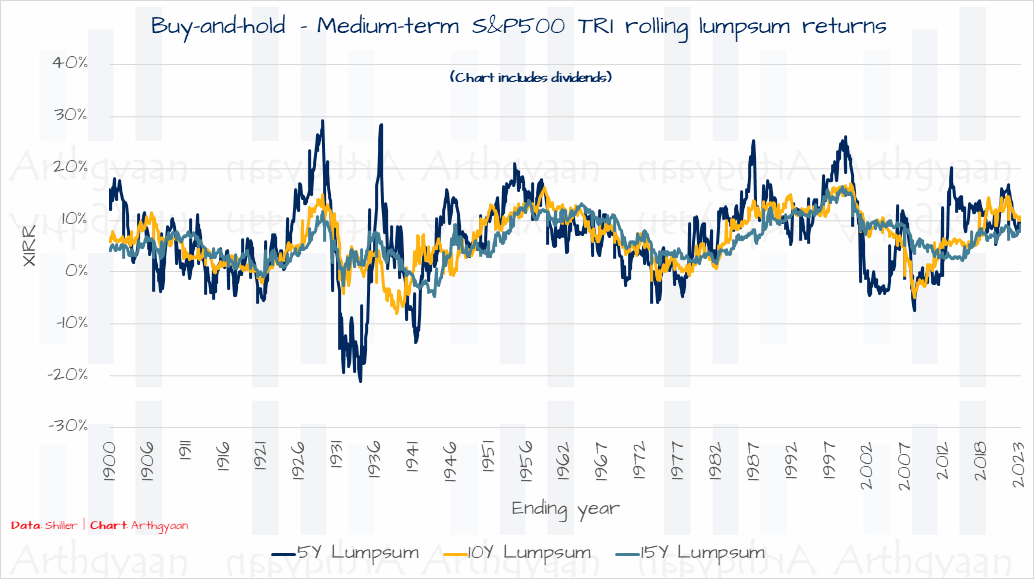
| Any 5Y period | 6.7% | 8.0% | 7.3% | (-21.1%) | 29.1% |
| Any 10Y period | 6.4% | 5.0% | 6.1% | (-8.0%) | 17.0% |
| Any 15Y period | 6.1% | 3.9% | 5.8% | (-4.7%) | 16.4% |
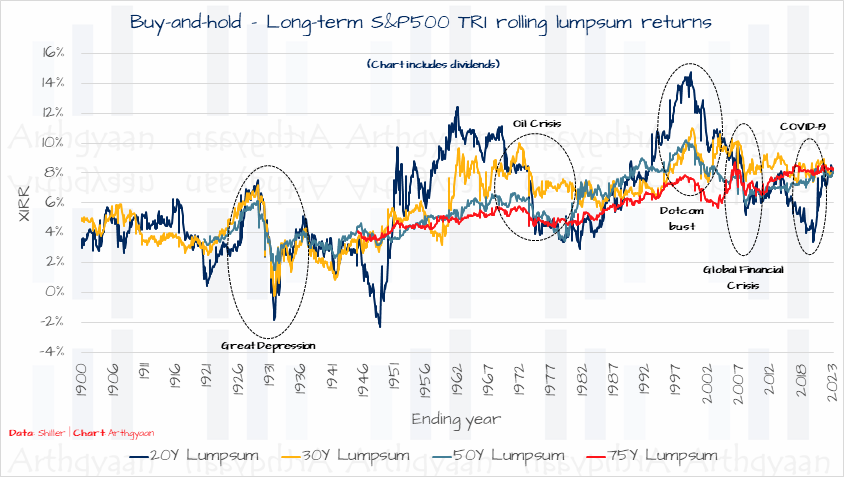
| Any 20Y period | 6.0% | 3.2% | 5.5% | (-2.3%) | 14.7% |
| Any 30Y period | 6.0% | 2.3% | 6.2% | (-0.3%) | 11.0% |
| Any 50Y period | 5.8% | 1.9% | 5.9% | 1.5% | 10.2% |
| Any 75Y period | 5.9% | 1.4% | 5.6% | 3.4% | 8.7% |
Long-term returns
Medium-term returns
Short-term returns
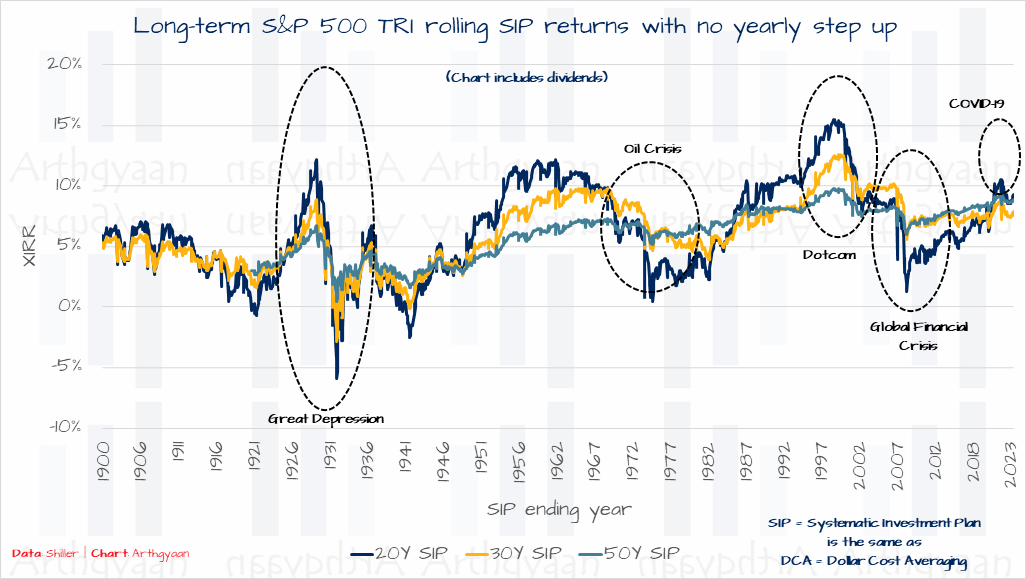
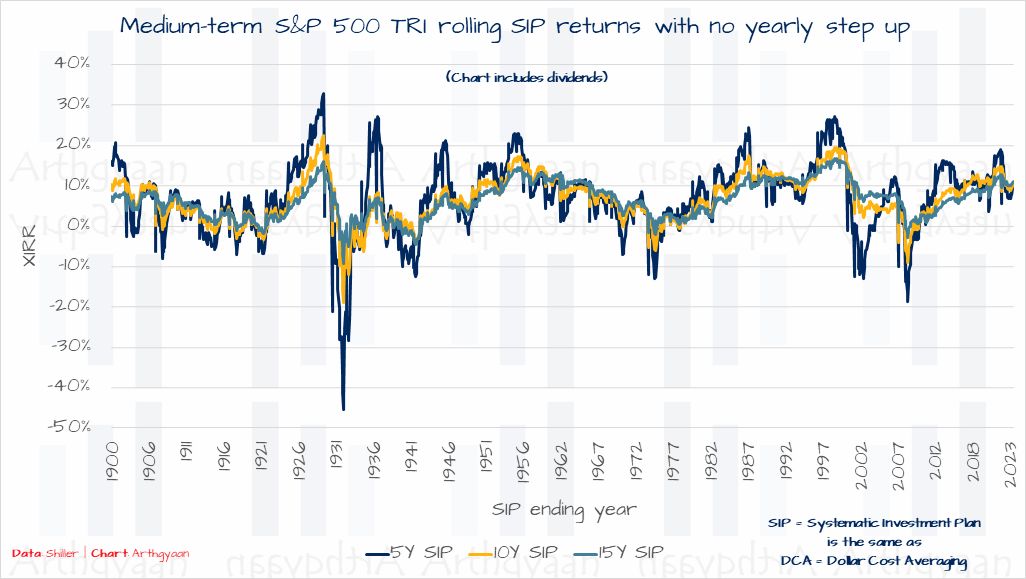
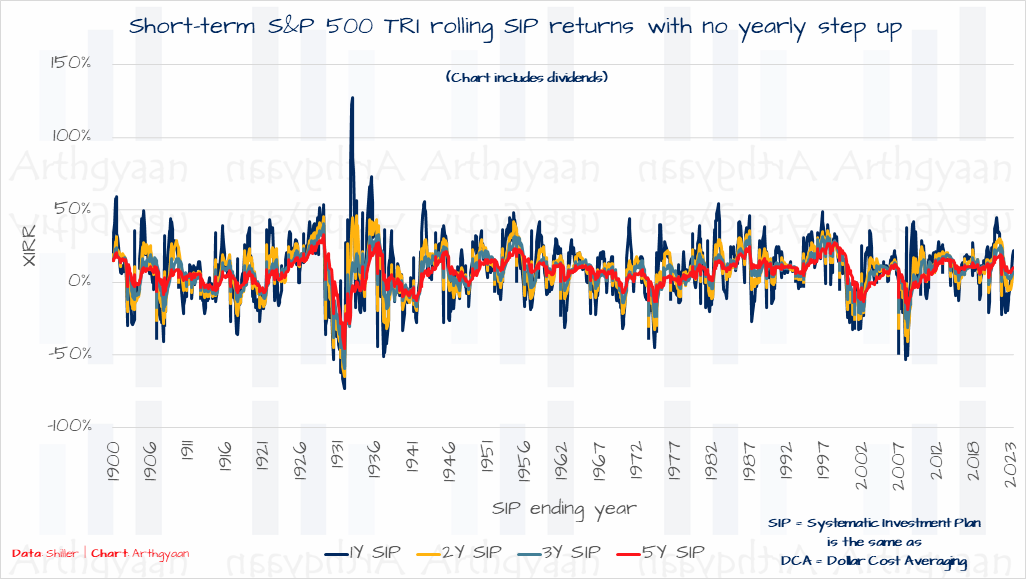
Here we analyse the XIRR of a SIP run with a fixed dollar amount being invested.
Average, max and min returns
| Metric | Average | StdDev | Median | Minimum | Maximum |
|---|---|---|---|---|---|
| Any 1Y period | 8.7% | 20.9% | 9.9% | (-72.9%) | 127.5% |
| Any 2Y period | 7.8% | 15.2% | 9.3% | (-64.6%) | 45.8% |
| Any 3Y period | 7.4% | 12.0% | 9.0% | (-59.0%) | 40.8% |
| Any 5Y period | 7.1% | 9.1% | 7.4% | (-45.6%) | 32.9% |
| Any 10Y period | 6.7% | 5.7% | 6.8% | (-19.0%) | 22.4% |
| Any 15Y period | 6.5% | 4.5% | 6.7% | (-9.3%) | 16.6% |
| Any 20Y period | 6.3% | 3.7% | 6.1% | (-5.9%) | 15.5% |
| Any 30Y period | 6.2% | 2.7% | 6.2% | (-2.8%) | 12.6% |
| Any 50Y period | 6.1% | 2.0% | 6.6% | 0.5% | 9.8% |
| Any 75Y period | 6.3% | 1.4% | 5.9% | 3.3% | 8.5% |
There are two main observations here:
Long-term returns
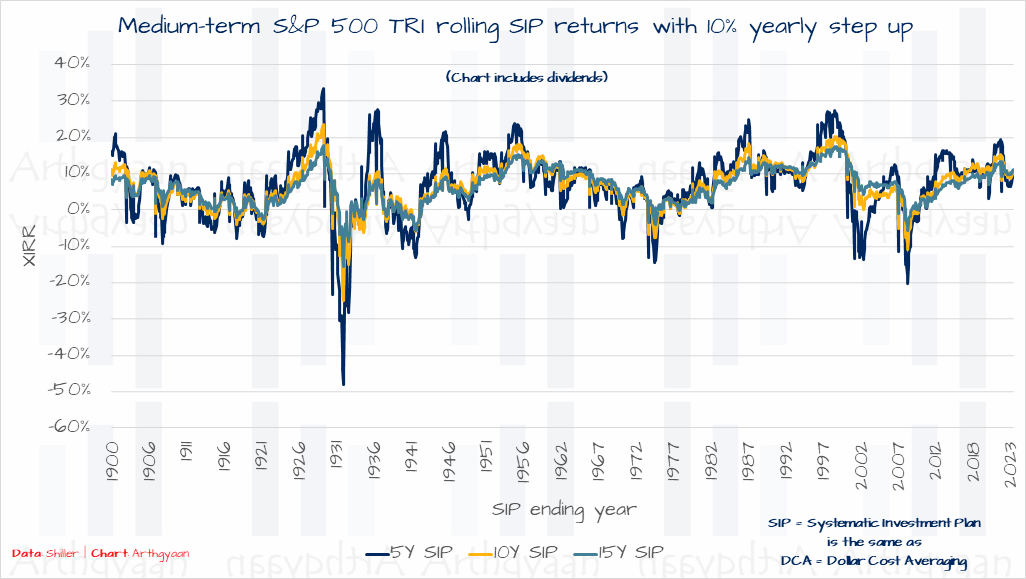
Medium-term returns
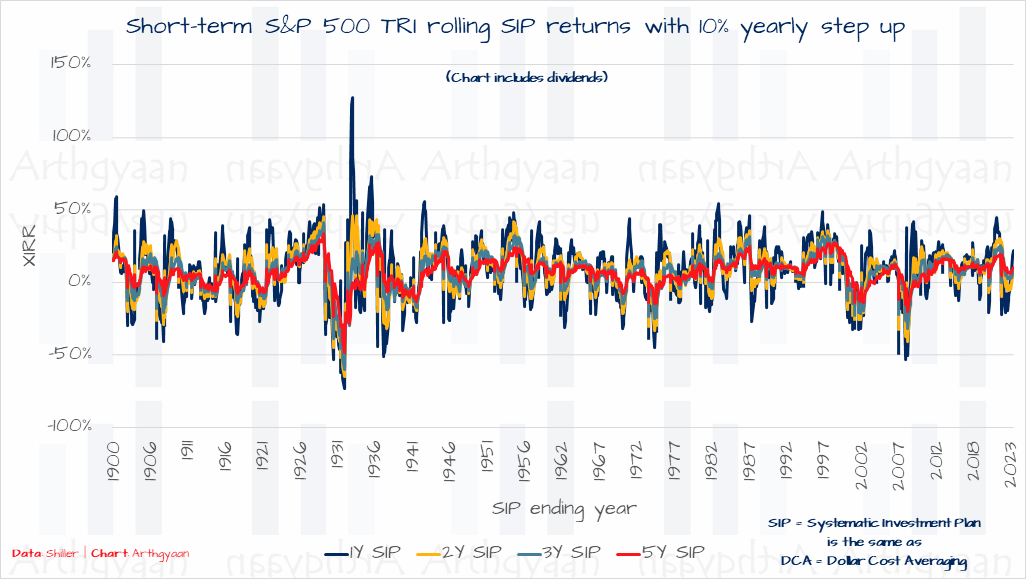
Short-term returns
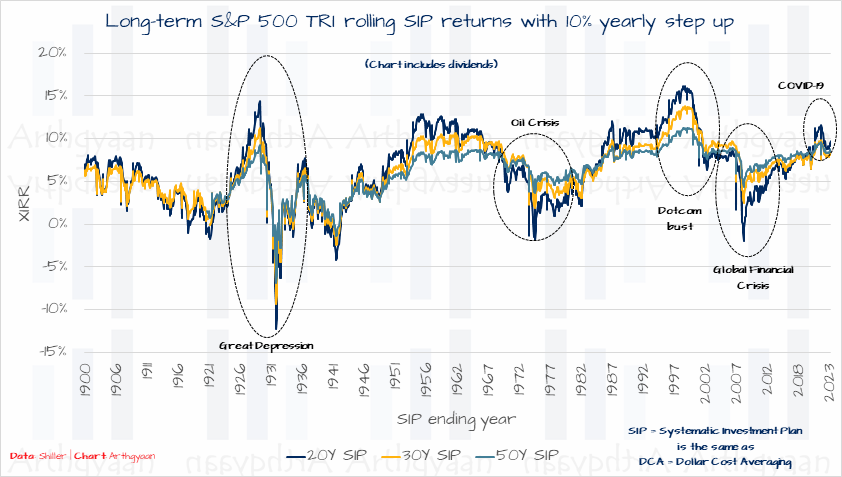
Here we analyse the XIRR of a SIP run with a 10% step up (Year 1 = $1,000/month, Year 2 = $1,100/month etc.) every year.
Average, max and min returns
| Metric | Average | StdDev | Median | Minimum | Maximum |
|---|---|---|---|---|---|
| Any 1Y period | 8.7% | 20.9% | 9.9% | (-72.9%) | 127.5% |
| Any 2Y period | 7.8% | 15.2% | 9.3% | (-65.0%) | 46.0% |
| Any 3Y period | 7.4% | 12.1% | 9.1% | (-59.8%) | 41.0% |
| Any 5Y period | 7.1% | 9.3% | 7.5% | (-48.2%) | 33.4% |
| Any 10Y period | 6.8% | 6.0% | 7.1% | (-25.0%) | 23.5% |
| Any 15Y period | 6.6% | 4.9% | 6.9% | (-15.7%) | 17.6% |
| Any 20Y period | 6.4% | 4.1% | 6.6% | (-12.3%) | 16.1% |
| Any 30Y period | 6.3% | 3.2% | 6.4% | (-9.3%) | 13.8% |
| Any 50Y period | 6.4% | 2.6% | 7.2% | (-6.8%) | 11.3% |
| Any 75Y period | 7.1% | 1.5% | 7.5% | 2.7% | 10.2% |
We see here that even a long-term SIP of 50 years, which requires someone to start investing at say age 20 and continue until age 70 does not imply that the will necessarily make money.
Long-term returns
Medium-term returns
Short-term returns
While India had stock markets since the 1930s, we have easily available index data only from the 1970s for which we have SENSEX data. The US market has more than 100 year’s more data and has situations like the Great Depression, two World Wars, 1970s oil shocks etc for which it is difficult to get data for India. The key takeaways are:


1. Email me with any questions.
2. Use our goal-based investing template to prepare a financial plan for yourself.Don't forget to share this article on WhatsApp or Twitter or post this to Facebook.
Discuss this post with us via Facebook or get regular bite-sized updates on Twitter.
More posts...Disclaimer: Content on this site is for educational purpose only and is not financial advice. Nothing on this site should be construed as an offer or recommendation to buy/sell any financial product or service. Please consult a registered investment advisor before making any investments.
This post titled How much Long-Term Wealth has been Built with Equity Investing in the US Stock Market? first appeared on 25 Oct 2023 at https://arthgyaan.com