How do you measure the performance of an individual mutual fund?
Learn how to evaluate your active fund against a benchmark by combining return and risk
 Portfolio Review
Learn how to evaluate your active fund against a benchmark by combining return and risk
We have already covered why you need to regularly check how a mutual fund is performing against the benchmark. This is important since as per the definition of an active fund, the fund manager is taking high fees to beat the benchmark. It is just basic common sense for you as the investor to know if you are getting your money’s worth.
Many websites offer various return metrics (1 week, 6 months, 1 year, 2 years etc) of the fund versus benchmark and peers. They also provide a risk number measured by standard deviation over 3 years or 5 years of data. However, these are snapshots and do not give a sense of consistency over time.
Consistency is measured by rolling return and rolling risk plotted in a chart vs. time. The concept is like this:
Repeat the same for rolling risk (for say 1-year price movement) and plot it in a chart. A few mutual fund portals have started providing this information but most keep it behind a paywall. However, it is easy to get the data and calculate it yourself.
We need daily price data (date, NAV or price, fund name) for the fund and peer(s) and the benchmark index.
For funds, this data comes from
Benchmark index data is found in https://www.nseindia.com or https://www.bseindia.com
There is a caveat that the fund may change the benchmark from time to time and it is important that the right benchmark’s data is used to do this calculation in various periods. Since price levels of different indices are not comparable, they need to be compared using the return series. For example if a fund had benchmark X in 2019 and shifted to Y in 2020 then the return series will have returns of X in 2019 and returns of Y in 2020. Do not use returns of Y in 2019 since that will be an incorrect comparison.
and so on.
Alternatively, daily price return data (Price_today/Price_yesterday-1) can be used to find rolling return using the geometric mean function in Excel i.e. rolling return of 1 year = Geometric Mean (1+Price series of 1 year)^250-1.
Since there are 250 data points in the rolling window, we need at least 250 points to get one value in the rolling chart. If there are 5 years of rolling price data (1250 data points), then the chart will have 1000 rolling values.
We use the standard deviation of daily price return data to calculate this using the STDEV function in Excel. Since 1 year has 250 trading days, the rolling risk of 1 year = STDEV (Price series of 1 year) * sqrt(250).
We have taken a popular active fund and compared that against the Nifty 50 price index and an index fund that tracks the Nifty 50. Regular plans for all are taken to get a longer period of data (since direct plans came in 2013 onwards). The conclusions will not be materially impacted by this decision of choosing regular funds. The fund names are deliberately not mentioned since the focus is on teaching this evaluation framework.
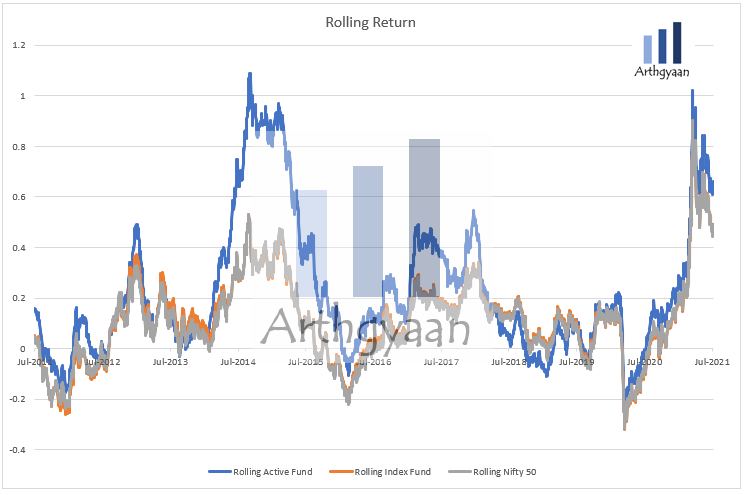
This chart shows rolling returns since July 2011 to date using 250 daily price returns as the window size. We are looking for periods where the rolling return is higher compared to the benchmark.
We see that in the period from Dec-2013 to Sep-2014 there was a huge outperformance against the index but after that time, the performance fell rapidly but stayed above the index until the end of 2017. This streak of underperformance continued until mid-2019.
Outperformance started again after Mar 2020 and has stayed mostly like that until the time of publication.
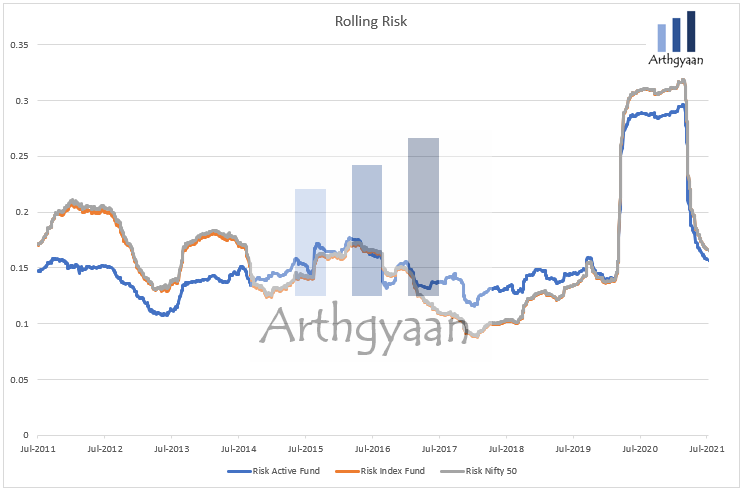
This chart shows rolling risk since Jul-2011 to date using 250 daily price returns as the window size. We are looking for periods where the rolling risk is lower compared to the benchmark.
We see that from Jul-2011 until Sep-2014 the risk of the fund has been lower than the benchmark. The opposite is seen in Mar-2017 to Feb-2020 which indicates that the fund was riskier to invest in during this period.
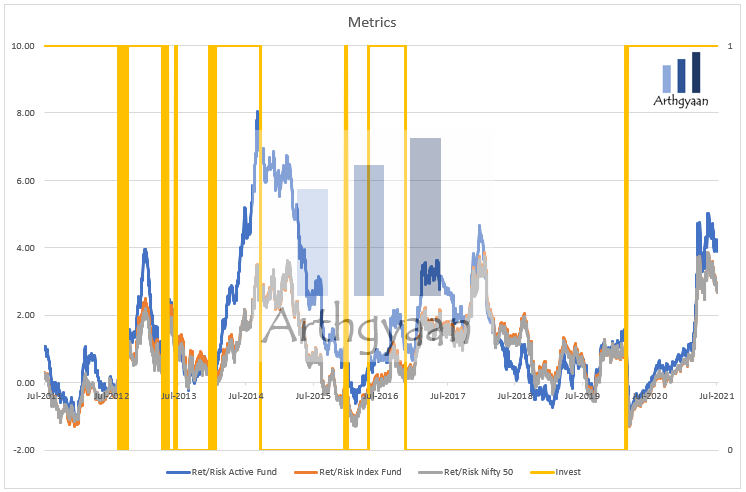
We combine risk and return together in one metric by dividing rolling return by rolling risk and create another chart. This is not Sharpe Ratio which is (Return-Risk Free Rat)/Risk. This Return/Risk is a very simple metric that allows you to quickly compare the fund vs the benchmark using one number. We also create a flag called Invest (value of 0 and 1) where Invest = 1 when the return of the fund is more than the index and risk is less compared to the index.
We see that the risk and return metric is showing those periods where the return per unit risk taken is higher compared to the index. However, a more interesting trend is seen using the Invest flag since it marks the period where there has been considerable fluctuation from Nov-2016 to Feb-2020.
These metrics should be used to indicate changes in fund performance that require detailed scrutiny of fund performance going forward. They should not be used to predict what kind of return is expected to be got by holding the fund. The metrics may oscillate (Aug-2012 to Sep-2012) or stay fixed for long periods (May-16 to Nov-16). Whenever there is an indication of a change of trend, due to the tendency of oscillation, it is better to review a month or two later. Many other metrics can be constructed using this data.
You should realize by looking at this data that it is very difficult to predict in advance when the fund will give better performance compared to the index in the future. This is why active funds require continuous monitoring and require switching in case the investor does not have the conviction that the fund will eventually outperform the index going forward. Since switching has costs due to capital gains tax, you will permanently lose money every time you switch. The solution to this problem is to switch to index funds.

1. Email me with any questions.
2. Use our goal-based investing template to prepare a financial plan for yourself.Don't forget to share this article on WhatsApp or Twitter or post this to Facebook.
Discuss this post with us via Facebook or get regular bite-sized updates on Twitter.
More posts...Disclaimer: Content on this site is for educational purpose only and is not financial advice. Nothing on this site should be construed as an offer or recommendation to buy/sell any financial product or service. Please consult a registered investment advisor before making any investments.
This post titled How do you measure the performance of an individual mutual fund? first appeared on 15 Jul 2021 at https://arthgyaan.com