Are you running your own mutual fund? Is it doing well?
When you are investing in stocks directly, are you measuring your performance as a fund manager?
When you are investing in stocks directly, are you measuring your performance as a fund manager?

Direct stock investing (DSI henceforth), whether for short duration (day trading or swing trading) or for long holding period attract many people. DSI is nowadays very easy due to the proliferation of discount brokers, social media experts and overall information availability. Since the market bottom of March 2020, many new investors have come to the market on the back of the bull run that started in April 2020.
The alternative of DSI is investing in equity mutual funds which means that each DSI investor is effectively running their personal mutual fund. Since all mutual funds should be periodically reviewed, how do you review the performance of your personal fund?
This is important because the purpose of investing is to meet a goal and for that, it is important to know if you are doing as well as you should. It is common among investors to say that their investment has got 20% CAGR or 15% XIRR but is that better or worse than a benchmark? This post deals with a simple way to measure the performance of DSI. Once the calculation is done, it is up to the investor to make the rational choice of implementing whichever strategy makes more money consistently.
There are multiple costs of investing in stocks directly, some of which are known and measurable while the rest are not.
The premise of measuring the performance of DSI vs. mutual funds is seeing if the profit in DSI after all costs is more than if the money was simply invested in the Nifty index or an equivalent Nifty/Sensex index fund. The choice of the index is not that important since it can be argued that for example DSI in small-cap stocks should be benchmarked against the Small Cap index which is nowadays investible via index funds. However, investing in a Nifty Index fund is the simplest thing any investor can do and is therefore good enough for the choice of the benchmark for DSI.
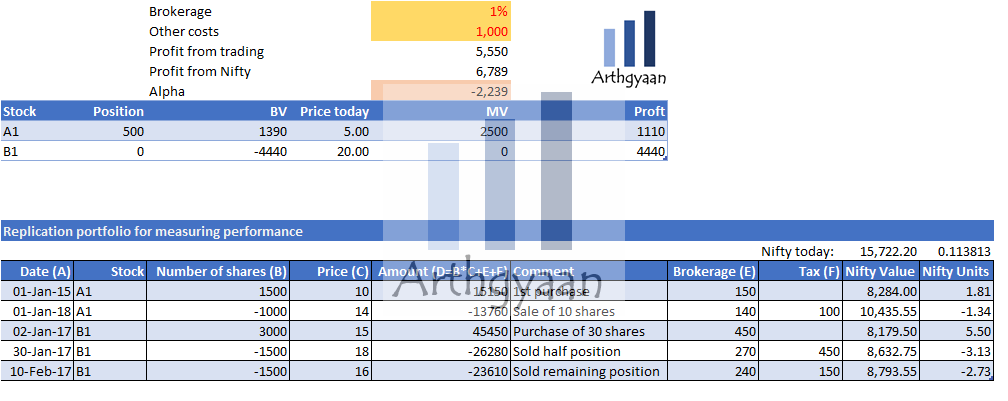
We will create a replicated portfolio like this. For every trade (buy or sell), we will take the pre-tax price of the trade (market price times shares) and calculate if the money was invested in the Nifty index (or Nifty index fund), and then how many units of the index would have been bought (or sold). The sum of the index units multiplied by the current price of the index shows the amount that would have been there if there was no DSI. Ideally, the investor should do whichever strategy gives higher profits: DSI or Replication consistently.
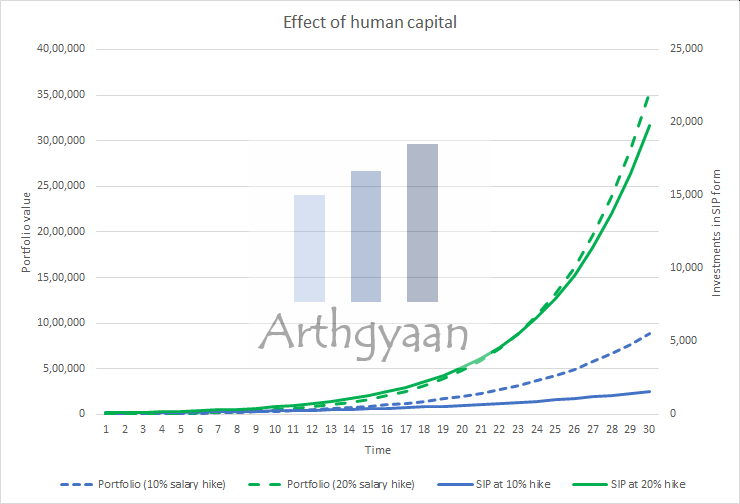
Growing wealth depends on both income and investments and is one of the axioms of personal finance. There is an intrinsic limit to the amount of time you can spend per day or week in your primary profession. If you know your hourly wage, and you should like this, you should also be aware that you cannot scale the denominator i.e. hours/day indefinitely. This leads to the concept of increasing human capital, where you are enhancing your skills and knowledge to increase your income - both active income from your profession and passive income from other sources.

If you are investing in stocks directly, either trading and investing, you are spending a good amount of time in that activity trying to get higher returns. You should consider if it will be prudent to divert that time to your profession instead to increase your income to get more capital for investing. Human capital is covered in more detail here: Your human capital, not investment returns, is your biggest wealth creator.

Here we have two stocks A1 and B1 that have been traded from 2015 to 2017. Brokerage is assumed at 1% of trade value (change it to what applies to you) and capital gains tax is included for sell trades. There is another field called Other costs for any regular costs like subscription or brokerage plan costs. The Nifty value/units columns have the replication values. We take the value of Nifty on that day and calculate the Nifty units bought or sold.
In the example, there is a ₹ 1,000 cost of executing the trading strategy.
As the table shows, profit in the case of holding the Nifty portfolio is ₹ 6,789 while that of the DSI portfolio is ₹ 5,550. This lower alpha (DSI minus Nifty) is made worse by the ₹ 1,000 execution cost so the DSI portfolio is worse off vs. the replication portfolio.
We show these calculations in the Excel sheet here.
If you get a positive alpha figure after costs then that is good news since you are beating the replicated portfolio. If not, you need to decide soon how long you are planning to continue with DSI before switching to mutual funds.

Published: 23 December 2025
6 MIN READ

Published: 18 December 2025
8 MIN READ
1. Email me with any questions.
2. Use our goal-based investing template to prepare a financial plan for yourself.Don't forget to share this article on WhatsApp or Twitter or post this to Facebook.
Discuss this post with us via Facebook or get regular bite-sized updates on Twitter.
More posts...Disclaimer: Content on this site is for educational purpose only and is not financial advice. Nothing on this site should be construed as an offer or recommendation to buy/sell any financial product or service. Please consult a registered investment advisor before making any investments.
This post titled Are you running your own mutual fund? Is it doing well? first appeared on 06 Jul 2021 at https://arthgyaan.com