Retirement Calculator with Step-Up SIP and FIRE number
How to use the Arthgyaan Retirement Calculator with Step-Up SIP and FIRE number?
You need to enter these numbers to use the calculator:
- Time Left To Retire: How many years is left between today and retirement start
- Monthly Expenses (in 2026 rupees): This is what you plan to spend in retirement in today’s money. This will automatically adjusted for inflation.
- Starting Lump Sum:: This is what you already have saved for retirement in assets like EPF, PPF, FD, NPS, Mutual Funds, Stocks etc. Enter their current value here.
The calculator will automatically calculate the SIP amount that you need. For retirement starting in 15 years, and if the investor already has around ₹30 lakhs saved, the SIP amount will be ₹99,986.00
Monthly SIP (₹):
Required Monthly SIP (₹):
Total Investment (₹):
Target Value (₹):
Inflation-Adjusted Value (₹):
Also try out our Monte Carlo simulation-based FIRE calculator.
If you are looking to understand how to best manage your mutual fund portfolio, you can get a free Mutual fund portfolio review.
What other features does the Retirement Calculator with Step-Up SIP and FIRE number have?
Other optional fields that you can set:
Lifetime Real returns of the Portfolio
Real Returns in Retirement (%): For a portfolio lasting multiple decades, it is a reasonable assumption that the total returns will be very close to inflation i.e. zero real returns. To learn more in this concept read this: How much returns should you expect from your retirement portfolio?
Step-up SIP investment to create more wealth
Annual Step-Up (%):: If you step-up your SIP amount along with salary / income hikes, then you will create a larger corpus: What is a step-up SIP and how much more wealth does it create vs. a normal SIP?
Inflation adjustment to take care of rising prices
Inflation is an important input to goal-planning in an economy where prices are rising overall. We can use the rule of 72 as a convenient mental shortcut to understanding the impact of inflation: Inflation: the impact on your goals and how to choose assets that beat it
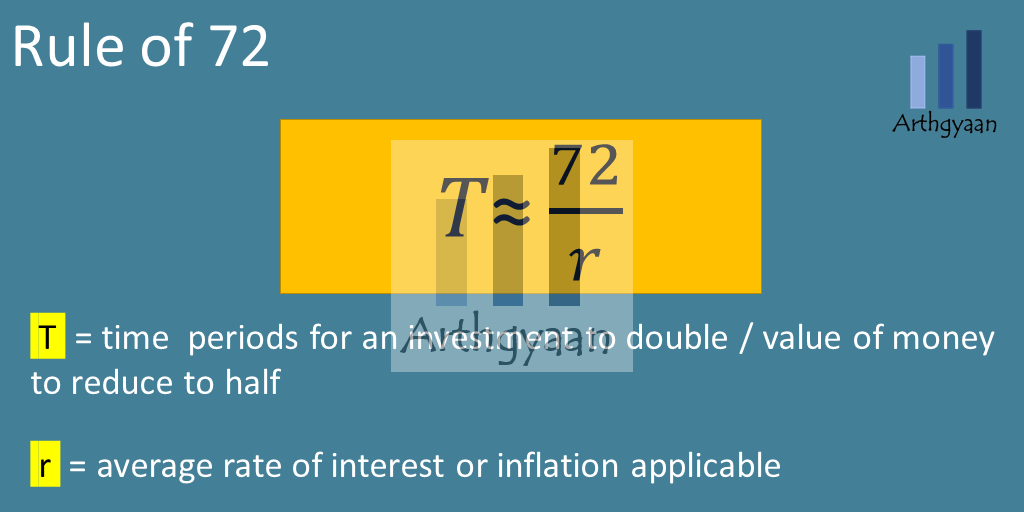
The rule says: Rate of doubling of prices * Time in years = 72
Rule of 72 lets us quickly calculate the impact of inflation over time. Using the rule, we can see that
- the purchasing power of money halves every ten years at 7% inflation. For example, one crore worth today will be worth 50 lakhs in 10 years and 25 lakhs in 20 years
- a lump sum payout, say from an insurance plan, is worth around four times less in today’s money if received in 20 years
- if you need one lakh/month in living costs in the first year of retirement, that will be two lakhs/month in ten years and four lakhs/month in twenty years
Which are the best investments for create a SIP for retirement?
Using the Choose a method for returns input option, the calculator lets you assume a fixed average return over time for your entire corpus or past market returns for various mutual funds.
To know which are the best mutual funds for your retirement portfolio, start with our free Mutual Fund Portfolio review.
Here is the latest data regarding mutual fund returns that will give you an estimate of what to expect based on past returns.
Equity Mutual Fund Returns
| Category | Any 1Y SIP | Any 2Y SIP | Any 3Y SIP | Any 5Y SIP | Any 7Y SIP | Any 10Y SIP |
|---|---|---|---|---|---|---|
| Equity: Contra | 16.18% | 17.0% | 18.48% | 18.97% | 18.59% | 19.26% |
| Equity: Dividend Yield | 10.72% | 13.28% | 15.75% | 16.21% | 17.38% | 17.66% |
| Equity: ELSS | 13.0% | 13.51% | 14.96% | 16.65% | 16.0% | 16.02% |
| Equity: Flexi Cap | 12.21% | 12.98% | 15.23% | 16.32% | 15.93% | 16.06% |
| Equity: Focused | 13.29% | 13.83% | 16.42% | 15.71% | 15.45% | 15.81% |
| Equity: Index | 7.0% | 8.99% | 13.81% | 14.49% | 14.54% | 13.85% |
| Equity: Large Cap | 11.96% | 12.54% | 14.29% | 14.25% | 14.43% | 14.58% |
| Equity: Large Mid Cap | 13.31% | 14.51% | 18.03% | 17.67% | 17.05% | 16.86% |
| Equity: Mid Cap | 16.03% | 17.32% | 20.45% | 20.42% | 19.87% | 19.42% |
| Equity: Multi Cap | 11.49% | 13.6% | 16.74% | 18.77% | 18.67% | 18.04% |
| Equity: Sectoral or Thematic | 11.02% | 13.24% | 16.76% | 16.47% | 16.29% | 16.73% |
| Equity: SIF Ex Top 100 Long Short | 0% | 0% | 0% | 0% | 0% | 0% |
| Equity: SIF Long Short | 0% | 0% | 0% | 0% | 0% | 0% |
| Equity: SIF Sector Rotation Long Short | 0% | 0% | 0% | 0% | 0% | 0% |
| Equity: Value | 13.41% | 15.15% | 17.3% | 16.6% | 16.26% | 16.56% |
| Category | Any 1Y SIP | Any 2Y 目↑ SIP | Any 3Y 目↑ SIP | Any 5Y 目↑ SIP | Any 7Y 目↑ SIP | Any 10Y 目↑ SIP |
|---|---|---|---|---|---|---|
| Equity: Contra | 16.18% | 16.86% | 18.37% | 19.19% | 18.99% | 19.55% |
| Equity: Dividend Yield | 10.72% | 13.23% | 15.59% | 16.33% | 17.69% | 18.01% |
| Equity: ELSS | 13.0% | 13.75% | 14.93% | 16.72% | 16.15% | 16.08% |
| Equity: Flexi Cap | 12.21% | 12.91% | 15.08% | 16.33% | 16.01% | 16.24% |
| Equity: Focused | 13.29% | 13.78% | 16.27% | 15.65% | 15.57% | 15.98% |
| Equity: Index | 7.0% | 8.88% | 13.57% | 14.36% | 14.57% | 13.93% |
| Equity: Large Cap | 11.96% | 12.47% | 14.19% | 14.26% | 14.57% | 14.73% |
| Equity: Large Mid Cap | 13.31% | 14.43% | 17.9% | 17.71% | 17.26% | 17.1% |
| Equity: Mid Cap | 16.03% | 17.16% | 20.27% | 20.55% | 20.24% | 19.78% |
| Equity: Multi Cap | 11.49% | 13.48% | 16.54% | 18.83% | 18.94% | 18.38% |
| Equity: Sectoral or Thematic | 11.02% | 13.18% | 16.66% | 16.61% | 16.55% | 17.03% |
| Equity: SIF Ex Top 100 Long Short | 0% | 0% | 0% | 0% | 0% | 0% |
| Equity: SIF Long Short | 0% | 0% | 0% | 0% | 0% | 0% |
| Equity: SIF Sector Rotation Long Short | 0% | 0% | 0% | 0% | 0% | 0% |
| Equity: Value | 13.41% | 15.08% | 17.1% | 16.82% | 16.52% | 16.87% |
| Category | Any 1Y | Any 2Y | Any 3Y | Any 5Y | Any 7Y | Any 10Y |
|---|---|---|---|---|---|---|
| Equity: Contra | 14.89% | 19.31% | 18.4% | 17.02% | 17.0% | 17.69% |
| Equity: Dividend Yield | 9.94% | 17.37% | 17.27% | 15.16% | 14.69% | 15.6% |
| Equity: ELSS | 11.98% | 16.41% | 16.16% | 16.27% | 15.02% | 15.64% |
| Equity: Flexi Cap | 11.24% | 16.16% | 16.69% | 16.24% | 14.95% | 15.37% |
| Equity: Focused | 12.54% | 16.99% | 17.09% | 16.39% | 14.93% | 15.4% |
| Equity: Index | 6.55% | 13.74% | 16.98% | 15.07% | 13.25% | 12.93% |
| Equity: Large Cap | 10.66% | 15.39% | 14.94% | 14.1% | 13.54% | 13.96% |
| Equity: Large Mid Cap | 12.31% | 17.3% | 18.29% | 17.46% | 15.73% | 16.09% |
| Equity: Mid Cap | 15.18% | 21.26% | 22.03% | 19.32% | 18.2% | 18.43% |
| Equity: Multi Cap | 10.16% | 18.07% | 19.41% | 17.98% | 16.77% | 16.77% |
| Equity: Sectoral or Thematic | 10.55% | 15.3% | 17.85% | 15.93% | 15.07% | 15.51% |
| Equity: SIF Ex Top 100 Long Short | 0% | 0% | 0% | 0% | 0% | 0% |
| Equity: SIF Long Short | 0% | 0% | 0% | 0% | 0% | 0% |
| Equity: SIF Sector Rotation Long Short | 0% | 0% | 0% | 0% | 0% | 0% |
| Equity: Value | 12.21% | 18.4% | 18.45% | 15.41% | 14.66% | 15.57% |
Debt Mutual Fund Returns
| Category | Any 1Y SIP | Any 2Y SIP | Any 3Y SIP | Any 5Y SIP | Any 7Y SIP | Any 10Y SIP |
|---|---|---|---|---|---|---|
| Debt: Banking And PSU | 7.65% | 7.53% | 7.4% | 7.02% | 6.85% | 7.11% |
| Debt: Corporate Bond | 7.58% | 7.63% | 7.39% | 7.03% | 6.97% | 7.24% |
| Debt: Credit Risk | 8.47% | 8.7% | 8.35% | 7.15% | 6.78% | 7.49% |
| Debt: Dynamic Bond | 7.82% | 7.76% | 7.46% | 7.14% | 6.95% | 7.3% |
| Debt: Floater | 7.67% | 7.71% | 7.62% | 7.29% | 7.1% | 7.25% |
| Debt: Gilt | 7.36% | 7.74% | 7.56% | 7.3% | 7.18% | 7.41% |
| Debt: Gilt With 10 Year Constant Duration | 8.48% | 8.39% | 7.79% | 7.24% | 6.91% | 7.55% |
| Debt: Index | 7.63% | 7.99% | 7.37% | 6.86% | 0% | 0% |
| Debt: Liquid | 6.62% | 6.68% | 6.51% | 6.09% | 5.87% | 6.0% |
| Debt: Long Duration | 5.44% | 5.41% | 5.65% | 7.21% | 6.68% | 7.38% |
| Debt: Low Duration | 7.52% | 7.81% | 7.6% | 6.96% | 6.73% | 6.74% |
| Debt: Medium Duration | 8.16% | 7.9% | 7.78% | 6.93% | 6.6% | 7.17% |
| Debt: Medium To Long Duration | 7.53% | 7.55% | 7.55% | 7.0% | 6.83% | 7.04% |
| Debt: Money Market | 7.14% | 7.15% | 7.14% | 6.78% | 6.42% | 6.51% |
| Debt: Overnight | 5.63% | 5.85% | 5.98% | 5.9% | 5.51% | 5.37% |
| Debt: Short Duration | 7.73% | 7.7% | 7.59% | 7.28% | 6.81% | 7.11% |
| Debt: Ultra Short Duration | 7.22% | 7.06% | 6.98% | 6.69% | 6.42% | 6.36% |
| Category | Any 1Y SIP | Any 2Y 目↑ SIP | Any 3Y 目↑ SIP | Any 5Y 目↑ SIP | Any 7Y 目↑ SIP | Any 10Y 目↑ SIP |
|---|---|---|---|---|---|---|
| Debt: Banking And PSU | 7.65% | 7.52% | 7.39% | 7.04% | 6.83% | 7.05% |
| Debt: Corporate Bond | 7.58% | 7.62% | 7.38% | 7.06% | 6.98% | 7.18% |
| Debt: Credit Risk | 8.47% | 8.7% | 8.29% | 7.2% | 6.86% | 7.58% |
| Debt: Dynamic Bond | 7.82% | 7.69% | 7.37% | 7.07% | 6.94% | 7.23% |
| Debt: Floater | 7.67% | 7.7% | 7.63% | 7.31% | 7.12% | 7.23% |
| Debt: Gilt | 7.36% | 7.72% | 7.37% | 7.25% | 7.15% | 7.29% |
| Debt: Gilt With 10 Year Constant Duration | 8.48% | 8.36% | 7.77% | 7.3% | 6.83% | 7.45% |
| Debt: Index | 7.63% | 7.92% | 7.33% | 6.88% | 0% | 0% |
| Debt: Liquid | 6.62% | 6.68% | 6.53% | 6.12% | 5.9% | 6.01% |
| Debt: Long Duration | 5.44% | 5.38% | 5.56% | 7.21% | 6.74% | 7.18% |
| Debt: Low Duration | 7.52% | 7.81% | 7.6% | 6.99% | 6.76% | 6.72% |
| Debt: Medium Duration | 8.16% | 8.02% | 7.63% | 6.84% | 6.73% | 7.2% |
| Debt: Medium To Long Duration | 7.53% | 7.53% | 7.25% | 6.85% | 6.83% | 7.01% |
| Debt: Money Market | 7.14% | 7.14% | 7.14% | 6.8% | 6.44% | 6.51% |
| Debt: Overnight | 5.63% | 5.85% | 5.98% | 5.92% | 5.56% | 5.39% |
| Debt: Short Duration | 7.73% | 7.7% | 7.48% | 7.2% | 6.87% | 7.09% |
| Debt: Ultra Short Duration | 7.22% | 7.06% | 6.89% | 6.62% | 6.45% | 6.34% |
| Category | Any 1Y | Any 2Y | Any 3Y | Any 5Y | Any 7Y | Any 10Y |
|---|---|---|---|---|---|---|
| Debt: Banking And PSU | 7.77% | 7.68% | 7.56% | 7.18% | 7.36% | 7.55% |
| Debt: Corporate Bond | 7.71% | 7.78% | 7.41% | 7.04% | 7.37% | 7.67% |
| Debt: Credit Risk | 8.47% | 8.66% | 8.38% | 6.68% | 6.89% | 7.74% |
| Debt: Dynamic Bond | 7.75% | 7.91% | 7.64% | 7.2% | 7.4% | 7.83% |
| Debt: Floater | 7.75% | 7.81% | 7.49% | 6.89% | 7.24% | 7.58% |
| Debt: Gilt | 7.26% | 8.07% | 7.77% | 7.72% | 7.85% | 8.03% |
| Debt: Gilt With 10 Year Constant Duration | 8.5% | 8.52% | 8.35% | 7.91% | 7.96% | 8.22% |
| Debt: Index | 7.87% | 8.2% | 7.56% | 6.2% | 0% | 0% |
| Debt: Liquid | 6.66% | 6.62% | 6.37% | 5.73% | 5.81% | 6.37% |
| Debt: Long Duration | 6.08% | 7.26% | 6.9% | 7.28% | 7.78% | 8.05% |
| Debt: Low Duration | 7.54% | 7.88% | 7.38% | 6.62% | 6.76% | 7.13% |
| Debt: Medium Duration | 8.09% | 8.11% | 7.95% | 6.64% | 6.88% | 7.52% |
| Debt: Medium To Long Duration | 7.72% | 7.68% | 7.53% | 7.15% | 7.12% | 7.4% |
| Debt: Money Market | 7.21% | 7.18% | 7.07% | 6.32% | 6.43% | 6.88% |
| Debt: Overnight | 5.66% | 5.8% | 5.64% | 5.17% | 5.11% | 5.76% |
| Debt: Short Duration | 7.8% | 7.76% | 7.68% | 6.9% | 7.16% | 7.56% |
| Debt: Ultra Short Duration | 7.28% | 6.9% | 6.75% | 6.28% | 6.45% | 6.81% |
Hybrid Mutual Fund Returns
| Category | Any 1Y SIP | Any 2Y SIP | Any 3Y SIP | Any 5Y SIP | Any 7Y SIP | Any 10Y SIP |
|---|---|---|---|---|---|---|
| Hybrid: Aggressive | 12.0% | 12.75% | 14.39% | 14.79% | 14.29% | 14.24% |
| Hybrid: Arbitrage | 6.76% | 6.73% | 6.73% | 6.45% | 6.18% | 6.31% |
| Hybrid: Balanced | 7.53% | 6.4% | 0% | 0% | 0% | 0% |
| Hybrid: Conservative | 9.22% | 9.42% | 9.43% | 8.69% | 8.49% | 8.68% |
| Hybrid: Equity Savings | 9.0% | 9.3% | 9.97% | 9.84% | 9.56% | 8.87% |
| Hybrid: Life Cycle 10 Years Maturity | 0% | 0% | 0% | 0% | 0% | 0% |
| Hybrid: Life Cycle 15 Years Maturity | 0% | 0% | 0% | 0% | 0% | 0% |
| Hybrid: SIF Long Short | 0% | 0% | 0% | 0% | 0% | 0% |
| Category | Any 1Y SIP | Any 2Y 目↑ SIP | Any 3Y 目↑ SIP | Any 5Y 目↑ SIP | Any 7Y 目↑ SIP | Any 10Y 目↑ SIP |
|---|---|---|---|---|---|---|
| Hybrid: Aggressive | 12.0% | 12.68% | 14.28% | 14.82% | 14.37% | 14.41% |
| Hybrid: Arbitrage | 6.76% | 6.73% | 6.74% | 6.49% | 6.19% | 6.36% |
| Hybrid: Balanced | 7.53% | 6.38% | 0% | 0% | 0% | 0% |
| Hybrid: Conservative | 9.22% | 9.4% | 9.4% | 8.69% | 8.56% | 8.72% |
| Hybrid: Equity Savings | 9.0% | 9.18% | 9.92% | 9.9% | 9.62% | 8.94% |
| Hybrid: Life Cycle 10 Years Maturity | 0% | 0% | 0% | 0% | 0% | 0% |
| Hybrid: Life Cycle 15 Years Maturity | 0% | 0% | 0% | 0% | 0% | 0% |
| Hybrid: SIF Long Short | 0% | 0% | 0% | 0% | 0% | 0% |
| Category | Any 1Y | Any 2Y | Any 3Y | Any 5Y | Any 7Y | Any 10Y |
|---|---|---|---|---|---|---|
| Hybrid: Aggressive | 11.44% | 14.76% | 14.75% | 14.19% | 13.33% | 13.57% |
| Hybrid: Arbitrage | 6.78% | 6.63% | 6.49% | 5.95% | 6.09% | 6.43% |
| Hybrid: Balanced | 7.36% | 9.2% | 0% | 0% | 0% | 0% |
| Hybrid: Conservative | 9.12% | 9.94% | 9.36% | 8.53% | 8.39% | 8.85% |
| Hybrid: Equity Savings | 8.87% | 10.29% | 10.18% | 9.31% | 8.96% | 8.58% |
| Hybrid: Life Cycle 10 Years Maturity | 0% | 0% | 0% | 0% | 0% | 0% |
| Hybrid: Life Cycle 15 Years Maturity | 0% | 0% | 0% | 0% | 0% | 0% |
| Hybrid: SIF Long Short | 0% | 0% | 0% | 0% | 0% | 0% |
What's next? You can join the Arthgyaan WhatsApp community
You can stay updated on our latest content and learn about our webinars. Our community is fully private so that no one, other than the admin, can see your name or number. Also, we will not spam you.For resident Indians 🇮🇳:
For NRIs 🇺🇸🇬🇧🇪🇺🇦🇺🇦🇪🇸🇬: To understand how this article can help you:

If you have a comment or question about this article
The following button will open a form with the link of this page populated for context:
Our Goal-based Investing Calculator
If you liked this article, please leave us a rating
The following button will take you to Trustpilot:Check out our two calculators:
Latest articles:


Topics you will like:
Asset Allocation (19) Basics (8) Behaviour (20) Budget (25) Budgeting (12) Calculator (40) Case Study (7) Children (22) Choosing Investments (41) FAQ (20) FIRE (20) Fixed Deposit (10) Free Planning Tool (16) Gold (32) Health Insurance (8) House Purchase (43) Index Funds (6) Insurance (20) International Investing (18) Life Stages (2) Loans (27) Market Data (10) Market Movements (32) Mutual Funds (102) NPS (17) NRI (44) News (46) Pension (11) Portfolio Construction (62) Portfolio Review (32) Reader Questions (9) Real Estate (16) Research (6) Retirement (46) Return to India (8) Review (29) Risk (8) Safe Withdrawal Rate (6) Screener (9) Senior Citizens (6) Set Goals (29) Step by step (15) Stock Investing (5) Tax (113)Next steps:
1.Email mewith any questions.
2. Use our goal-based investing template to prepare a financial plan for yourself.
We are currently at 588 posts and growing fast. Search this site: More posts...
![]()
Disclaimer: Content on this site is for educational purpose only and is not financial advice. Nothing on this site should be construed as an offer or recommendation to buy/sell any financial product or service. Please consult a registered investment advisor before making any investments.
Copyright © 2021-2026 Arthgyaan.com. All rights reserved. No part of this blog or contents may be reproduced or distributed without explicit written permission from Sayan Sircar.
Made by Arthgyaan with ❤ in 🇮🇳