How much returns should you estimate for your goals?
This article helps you estimate the returns from your investments to help you decide how much you need to invest.
This article helps you estimate the returns from your investments to help you decide how much you need to invest.


Once you have fixed a goal amount and target date, say 60 lakhs in 10 years, you need to determine how much returns you are expected to get over these 10 years to reach the target of 60 lakhs.
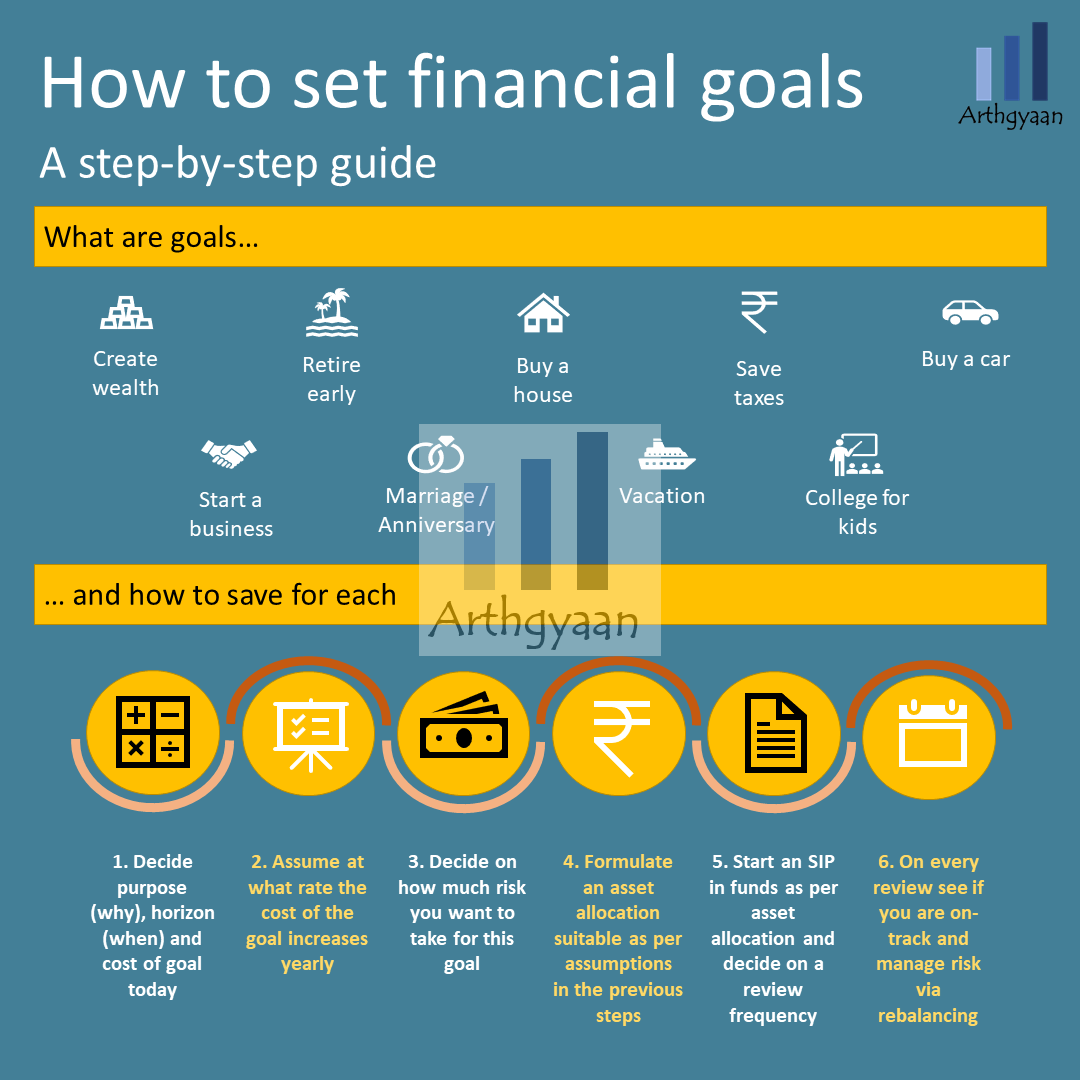
This return estimation step lets you determine how much you need to invest today as a lump sum and regularly every month.
Return estimation is part of Step 5 of the goal-based investing process described here: I am now ready to do goal-based investing. What now?.
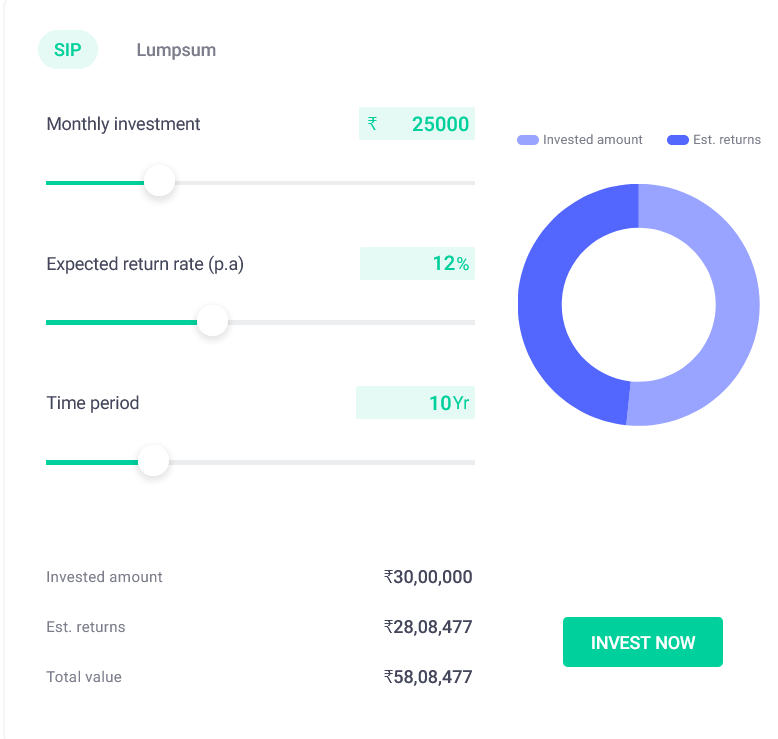
The above image, from the Groww website, is a simple SIP calculator. The 12% return assumption is an average figure that gives a false impression that the investment will grow smoothly like an FD. In reality, if you are investing in the stock market, the return looks like this:
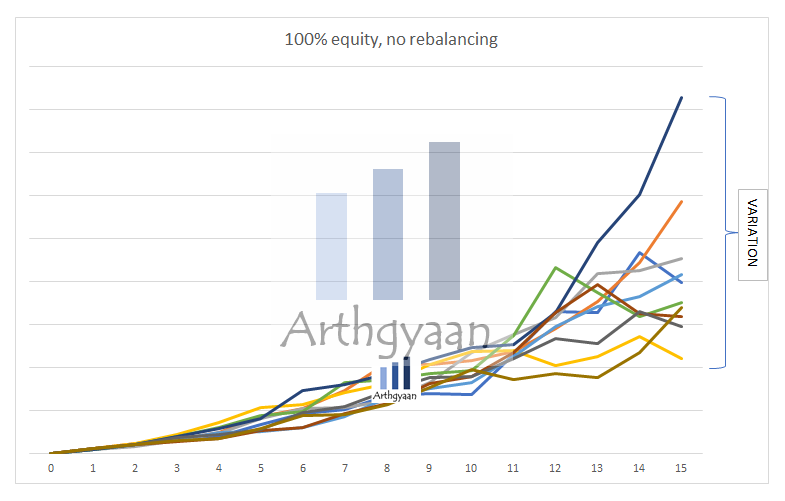
Each of those lines is a portfolio whose ending value is unknown today on the starting date.
We have covered the concept of goal-based investing that converts the journey from the above to this:
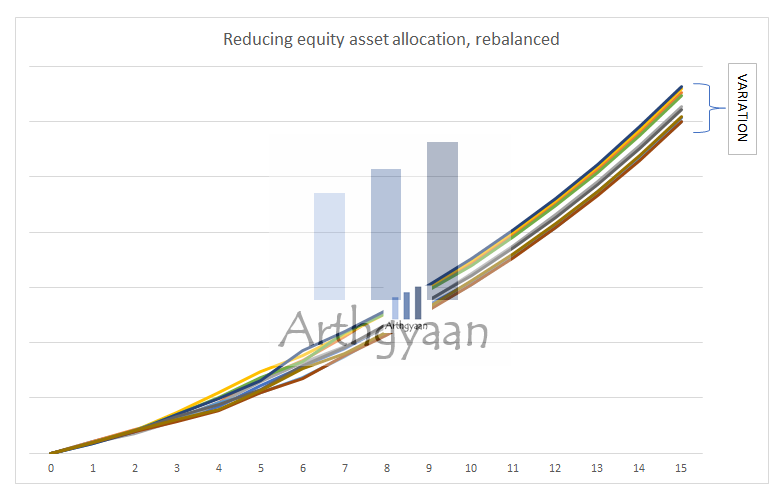
Read more on goal-based investing here: I am now ready to do goal-based investing. What now?.
To determine the return, you need to choose the assets first. We will use a mix of equity and debt assets, both investible via mutual funds, for our goals. The basic premise of asset allocation is a balance of the investor’s goal priority (needs vs wants) and the time horizon of the goal like this:
Here are some sample asset allocations depending on the risk profile and duration of the goal. Before using them, investors should understand their risk profile using a tool like this and be comfortable with the amount of risk they are taking.
You can read more on the concept of asset allocation here: What should be the Asset Allocation for your goals?. Once the asset is fixed, the next step is to create a glide-path to manage risk.
The image shows the glide path of a medium goal that starts at 60:40 and is step-wise reduced as the goal comes closer. It follows the same allocation numbers in the “Medium” case in the table above as described in detail here. The key takeaway is that asset allocation is not constant over the life of the goal due to a risk called sequence of return risk since the stock market is unpredictable. Therefore, just starting a SIP and increasing the SIP by 5-10% does not imply that you will meet the goal. This concept of rebalancing and review is discussed in more detail in this post on reviewing the goal’s progress.
Using some assumptions below:
The range is determined as:
The way to interpret the table is that, for example, for the medium-risk 10-year goal, the SAA is 30:70, and the return for that particular year can be between -8.2% to 15.6%. But, of course, this is an estimate. The actual return for a 30:70 goal may differ from the values given above, depending on market conditions.
The return numbers in the table above are still a range and are not helpful yet. We will perform one more calculation to get a single number for the entire investment since asset allocation changes throughout the life of the goal.
We have assumed that equity as an asset class gives a return, called the risk premium, higher than inflation.
We will combine the risk premiums with inflation like this:
Expected return = (1 + Inflation) * (1 + Risk Premium) - 1
We get for a 60:40 asset allocation, the expected returns, with 7% inflation and risk premiums as 3% and -3%, respectively, as:
Equity return = 1.07 * 1.03 - 1 = 10.21%
Debt return = 1.07 * 0.97 - 1 = 3.79%
60:40 portfolio return = 0.6 * 10.21 + 0.4 * 3.79 = 7.642%
While this value of 7.642% is higher than inflation, we progressively reduce the asset allocation to more conservative values as the goal becomes closer. This derisking reduces the average return from 7.642% to a lower figure.
| Time left | Equity % | Debt % | Weighted return % | Average return % | Real return |
|---|---|---|---|---|---|
| 25 | 60% | 40% | 7.642% | 6.166% | -0.779% |
| 24 | 60% | 40% | 7.642% | 6.105% | -0.836% |
| 23 | 60% | 40% | 7.642% | 6.039% | -0.898% |
| 22 | 60% | 40% | 7.642% | 5.967% | -0.966% |
| 21 | 60% | 40% | 7.642% | 5.888% | -1.040% |
| 20 | 60% | 40% | 7.642% | 5.801% | -1.121% |
| 19 | 60% | 40% | 7.642% | 5.705% | -1.211% |
| 18 | 60% | 40% | 7.642% | 5.598% | -1.310% |
| 17 | 60% | 40% | 7.642% | 5.479% | -1.422% |
| 16 | 60% | 40% | 7.642% | 5.345% | -1.547% |
| 15 | 60% | 40% | 7.642% | 5.194% | -1.688% |
| 14 | 54% | 46% | 7.257% | 5.021% | -1.849% |
| 13 | 48% | 52% | 6.872% | 4.851% | -2.008% |
| 12 | 42% | 58% | 6.486% | 4.684% | -2.164% |
| 11 | 36% | 64% | 6.101% | 4.522% | -2.316% |
| 10 | 30% | 70% | 5.716% | 4.365% | -2.462% |
| 9 | 24% | 76% | 5.331% | 4.217% | -2.601% |
| 8 | 18% | 82% | 4.946% | 4.078% | -2.731% |
| 7 | 12% | 88% | 4.560% | 3.955% | -2.846% |
| 6 | 6% | 94% | 4.175% | 3.854% | -2.940% |
| 5 | 0% | 100% | 3.790% | 3.790% | -3.000% |
| 4 | 0% | 100% | 3.790% | 3.790% | -3.000% |
| 3 | 0% | 100% | 3.790% | 3.790% | -3.000% |
| 2 | 0% | 100% | 3.790% | 3.790% | -3.000% |
| 1 | 0% | 100% | 3.790% | 3.790% | -3.000% |
For a single-payment goal, which can be invested using a Target Date Fund, will have an expected return equal to the Average return % figure in the table above.
Let’s take the example of reaching 60 lakhs in 10 years. As per the table, we will need to assume that the expected return over this period is 4.365% or approximately 4.4% and use that in any SIP calculator. If you use the Arthgyaan goal-based investing calculator, then the calculator will handle the return estimation on its own with these inputs. The returns for equity and debt are assumed to be 11% and 4% on an average post-tax and the SIP amount is stepped-up by 5% per year.
Using the Arthgyaan goal-based investing calculator, we will see that the SIP amount for reaching 60 lakhs in 10 years will be around ₹32,500/month. The ₹32,500/month amount should be increased by 5% a year.
Return estimation for financial goals involves determining how much returns you are expected to get over a specific period to reach a target amount. This step lets you determine how much you need to invest today as a lump sum and regularly every month.
A simple return estimate of 12% for goals gives a false impression that the investment will grow smoothly like an FD. In reality, if you are investing in the stock market, the return is unpredictable and volatile.
To determine the return, you need to choose the assets first. A mix of equity and debt assets, both investible via mutual funds, can be used for goals. Asset allocation depends on the investor's goal priority and the time horizon of the goal.
Returns can be estimated by combining the risk premiums of equity and debt assets with inflation. The expected return is calculated as (1 + Inflation) * (1 + Risk Premium) - 1. Asset allocation changes throughout the life of the goal, so the average return decreases progressively as the goal becomes closer.
1. Email me with any questions.
2. Use our goal-based investing template to prepare a financial plan for yourself.Don't forget to share this article on WhatsApp or Twitter or post this to Facebook.
Discuss this post with us via Facebook or get regular bite-sized updates on Twitter.
More posts...Disclaimer: Content on this site is for educational purpose only and is not financial advice. Nothing on this site should be construed as an offer or recommendation to buy/sell any financial product or service. Please consult a registered investment advisor before making any investments.
This post titled How much returns should you estimate for your goals? first appeared on 15 Mar 2023 at https://arthgyaan.com