How does sequence of return risk affect your goals?
How risk management via glide-path and rebalancing mitigates sequence of return risk
How risk management via glide-path and rebalancing mitigates sequence of return risk

The concept of sequence-of-returns risk (SRR henceforth) refers to the order or mix of positive and negative returns that occur in risky assets like equity. The way to manage this risk lies in deciding on a portfolio glide path and managing risk via rebalancing.
SRR affects goals differently depending on whether they are accumulating (like saving for retirement) vs. whether they are in the distribution phase (like withdrawing in retirement). For example, the two sequences (-10%, 20%, 5%) and (-20%, 30%, 9%) lead to the same geometric average return of 14% but will impact a portfolio’s final value depending on whether cash is flowing in or out.
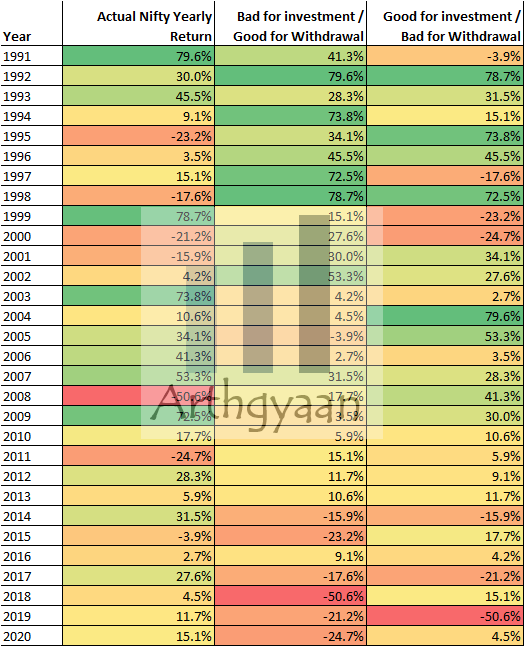
In the examples below, we consider 30-year Nifty 50 returns from 1991 to 2020 and create a few hypothetical scenarios to demonstrate the impact of SRR. For each case of accumulating or withdrawing, six different portfolios are created based on the asset allocation (AA). Debt funds are expected to return 4% before tax and each annual rebalancing event leads to 2% of the portfolio paid out in capital gains taxes.
Rebalancing means the following glide-path
Fixed AA means
The following return series are used:

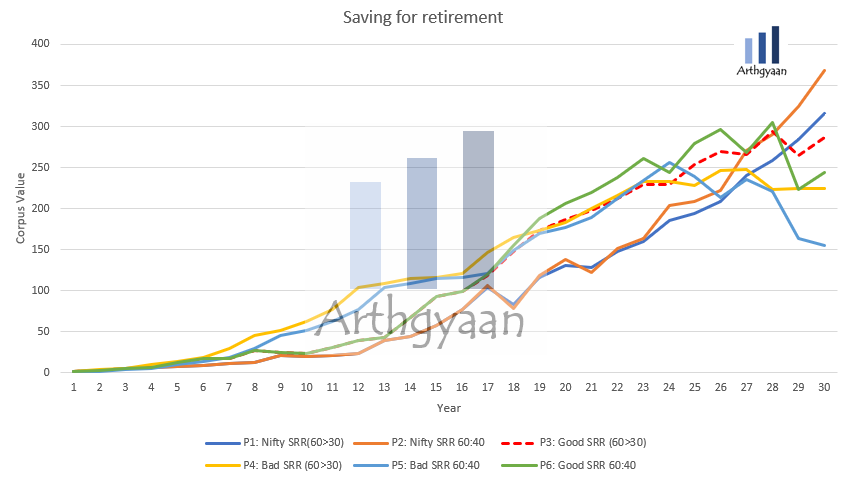
In the accumulation phase, a few low periods of returns at the beginning of the period is better than having them at the end when the corpus is much bigger and fully exposed to market risk. Also if the time left is very less and the asset allocation is very risky (say a 3-year goal mostly invested in equities) then there is a high chance of not being able to recover from an equity market fall before the goal is due.

In the calculation, the starting portfolio value is 0 and the starting SIP is 1 lakh a year increasing by 10% a year. The target is to achieve 3cr (2.94cr exact value) portfolio value for P1 portfolio at average 13% equity and 4% debt.
In the examples above, only P3 with its “good SRR being rebalanced yearly” comes closest to the 3cr line while P6 with the same SRR but not rebalanced comes much lower at 2.44cr. In the other cases, P4 and P5 with bad SRR come to a much lower value. The cases that go above 3cr i.e. P1 and P2 are two especially good SRR numbers (the actual Nifty return).
In all cases, however, there is a difference between the reducing equity glide-path and fixed AA which is due to risk management via rebalancing. In the case of P3-P6 and P4-P5, the rebalancing return is positive and in the case of P1-P2, it is negative. Even with that observation, the below recommendation is given. Only starting a SIP does not imply goals will be met since risk has to be continuously managed via an appropriate glide path and rebalancing. Otherwise, a bad sequence of returns has a huge chance of reduction in the final corpus as the graphs show.
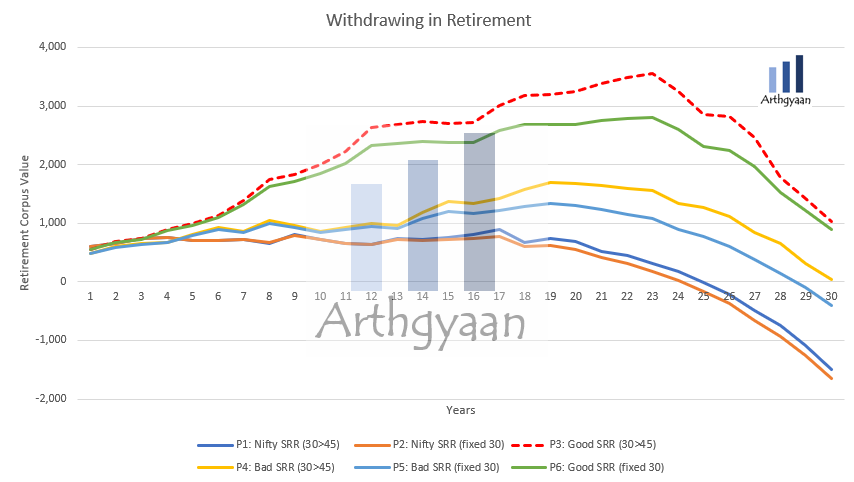
When withdrawing from a corpus in retirement, a large fall or a period of sideways equity market at the beginning of the period will deplete the equity corpus fast. This may lead to the failure of making the corpus last till the end of retirement. This problem can be tackled by having a higher allocation to safer assets like cash or high-quality debt to support withdrawal during the first few years using a concept like the bucket theory of asset allocation.

Here the same 6 portfolios are created with the difference being that definition of good and bad SRR has been flipped i.e. good SRR in investing is taken as the bad SRR in withdrawal and vice-versa.
In the calculation, the starting portfolio value is 5cr, the first year’s withdrawal is 18 lakhs increasing by 10% a year. The reason the glide path of the equity is increasing in retirement is that the further years are being funded by higher equity allocation (or conversely the closer years have a higher debt allocation). We see a repeat of the results of the accumulation phase with increasing equity glide path coming out as superior compared to fixed asset allocation in the good SRR, bad SRR and Nifty cases. Only the good SRR manages to beat the target of not running out of money.
Here as well the conclusion of having a suitable glide path and regular rebalancing is needed to reach the portfolio objective of having money left over at the end of the 30 years.
SRR also rears its ugly head when you have a unified portfolio. A market crash when a big goal is due will deplete the equity portion disproportionately. We have covered this in more detail in this post.
1. Email me with any questions.
2. Use our goal-based investing template to prepare a financial plan for yourself.Don't forget to share this article on WhatsApp or Twitter or post this to Facebook.
Discuss this post with us via Facebook or get regular bite-sized updates on Twitter.
More posts...Disclaimer: Content on this site is for educational purpose only and is not financial advice. Nothing on this site should be construed as an offer or recommendation to buy/sell any financial product or service. Please consult a registered investment advisor before making any investments.
This post titled How does sequence of return risk affect your goals? first appeared on 12 Jun 2021 at https://arthgyaan.com