Goal-based investing: does it work in India for lump sum investing?
This article shows the historical performance of single payment goals in India and whether it has worked for reaching the desired corpus if you invest a lump sum amount.
This article shows the historical performance of single payment goals in India and whether it has worked for reaching the desired corpus if you invest a lump sum amount.

This article is part of a series
This article is Part 2 and is a continuation of our previous post, which had examined if goal-based investing works for investing in SIP mode: Goal-based investing: does it work in India?. If you have not read that part yet, please do so now for the necessary context.
A lump sum amount is a relatively large sum of money you have and plan to invest for a particular goal in mind. A typical example is the amounts received for a child’s naming and other ceremonies that you wish to invest for their college education. We will assume that the sum is ₹2 lakh and will be used for the college education admission fee after 15 years in the charts below.
We will consider historical data from 1996 for equity (Sensex Total Return Index) and debt (money market fund).
In this example, we will use the inflation data for the last ten years and use that to predict the returns like this:
Equity return = Inflation + 3%
Debt return = Inflation - 2%
Here the offset to inflation is the risk premium.
We will combine the risk premiums with inflation like this:
Expected return = (1 + Inflation) * (1 + Risk Premium) - 1
We get for a 60:40 asset allocation, the expected returns, with 7% inflation and risk premiums as 3% and -3%, respectively, as:
Equity return = 1.07 * 1.03 - 1 = 10.21%
Debt return = 1.07 * 0.97 - 1 = 3.79%
60:40 portfolio return = 0.6 * 10.21 + 0.4 * 3.79 = 7.642%
While this value of 7.642% is higher than inflation, we progressively reduce the asset allocation to more conservative values as the goal becomes closer. This derisking reduces the average return from 7.642% to a lower figure.
| Time left | Equity % | Debt % | Weighted return % | Average return % | Real return |
|---|---|---|---|---|---|
| 25 | 60% | 40% | 7.642% | 6.166% | -0.779% |
| 24 | 60% | 40% | 7.642% | 6.105% | -0.836% |
| 23 | 60% | 40% | 7.642% | 6.039% | -0.898% |
| 22 | 60% | 40% | 7.642% | 5.967% | -0.966% |
| 21 | 60% | 40% | 7.642% | 5.888% | -1.040% |
| 20 | 60% | 40% | 7.642% | 5.801% | -1.121% |
| 19 | 60% | 40% | 7.642% | 5.705% | -1.211% |
| 18 | 60% | 40% | 7.642% | 5.598% | -1.310% |
| 17 | 60% | 40% | 7.642% | 5.479% | -1.422% |
| 16 | 60% | 40% | 7.642% | 5.345% | -1.547% |
| 15 | 60% | 40% | 7.642% | 5.194% | -1.688% |
| 14 | 54% | 46% | 7.257% | 5.021% | -1.849% |
| 13 | 48% | 52% | 6.872% | 4.851% | -2.008% |
| 12 | 42% | 58% | 6.486% | 4.684% | -2.164% |
| 11 | 36% | 64% | 6.101% | 4.522% | -2.316% |
| 10 | 30% | 70% | 5.716% | 4.365% | -2.462% |
| 9 | 24% | 76% | 5.331% | 4.217% | -2.601% |
| 8 | 18% | 82% | 4.946% | 4.078% | -2.731% |
| 7 | 12% | 88% | 4.560% | 3.955% | -2.846% |
| 6 | 6% | 94% | 4.175% | 3.854% | -2.940% |
| 5 | 0% | 100% | 3.790% | 3.790% | -3.000% |
| 4 | 0% | 100% | 3.790% | 3.790% | -3.000% |
| 3 | 0% | 100% | 3.790% | 3.790% | -3.000% |
| 2 | 0% | 100% | 3.790% | 3.790% | -3.000% |
| 1 | 0% | 100% | 3.790% | 3.790% | -3.000% |
Our calculations below will assume the historical ten-year average inflation and apply a risk premium to calculate the expected equity and debt returns. We will run the calculations for goals due from 3-15 years, starting from 1996 onwards. We are choosing 1996 since Sensex TRI data is available from that date onwards. We will present results like:
We show this example of a goal for which investment was started in 2007. Every year there is no additional investment, but the asset allocation was made more and more conservative over time. We can see how the equity allocation was reduced to zero as the goal moved closer.
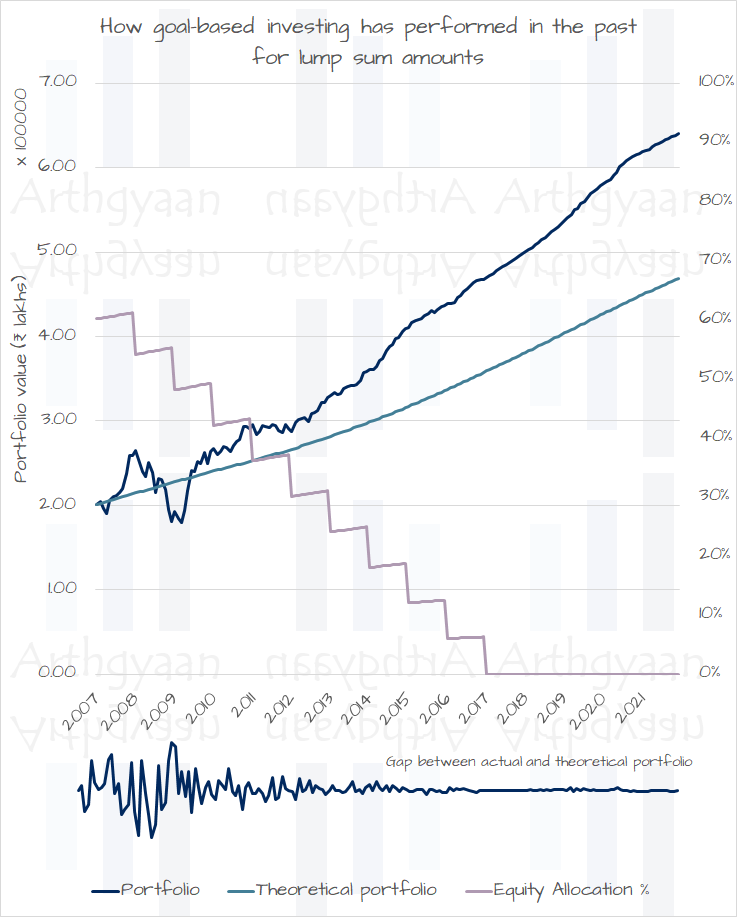
The key learning here is that the variability between the actual and theoretical portfolios slowly came close to zero over time.
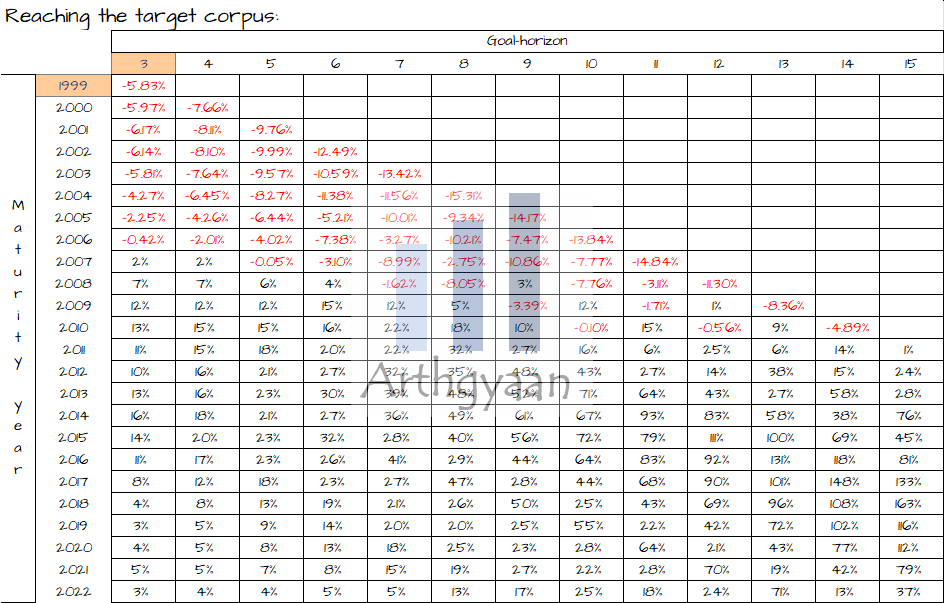
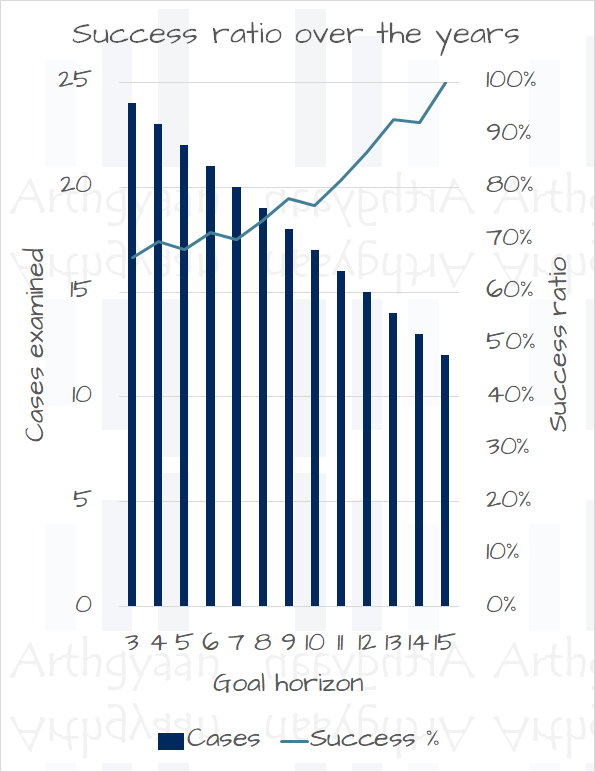
We see that except for goals maturing before 2011, in all other cases, the return has been higher than the theoretical return like this:
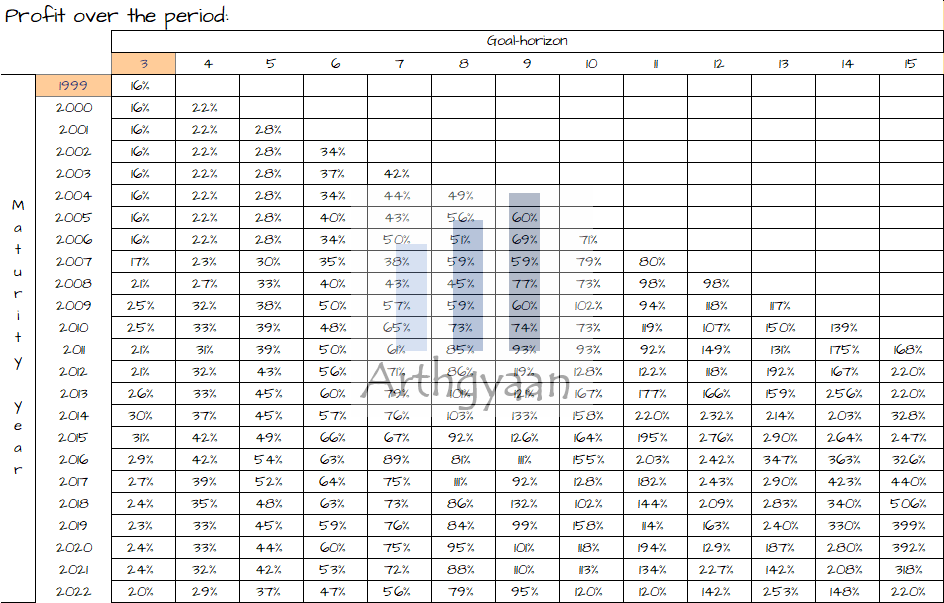
But there has not been a single case where the ending value has been lower than the starting value:
This article shows that goal-based investing for single-period goals has worked for historical data in India for a lump sum amount. In a future article, we will combine and examine the more typical case of starting with a lump sum and then doing a monthly SIP investment as well. For the SIP-only case, have a look at Part 1 here: Goal-based investing: does it work in India?.
1. Email me with any questions.
2. Use our goal-based investing template to prepare a financial plan for yourself.Don't forget to share this article on WhatsApp or Twitter or post this to Facebook.
Discuss this post with us via Facebook or get regular bite-sized updates on Twitter.
More posts...Disclaimer: Content on this site is for educational purpose only and is not financial advice. Nothing on this site should be construed as an offer or recommendation to buy/sell any financial product or service. Please consult a registered investment advisor before making any investments.
This post titled Goal-based investing: does it work in India for lump sum investing? first appeared on 21 Dec 2022 at https://arthgyaan.com