5.93% Fall in the Nifty: What Does Election Result Day Teach Us about Risk in Our Portfolio?
This article talks about the volatility in the stock market on 4th June 2024, which was the day of election results.
This article talks about the volatility in the stock market on 4th June 2024, which was the day of election results.

This article is a part of our detailed article series on Election 2024 and the following market gyrations. Ensure you have read the other parts here:
This article uses historical data to estimate returns expected from the stock market post-election.
This article discusses the strategies needed to profit off sudden market falls like that happened on election results day on 4th June 2024.
This article shows you the pros and cons of each approach you can take between today and the General Election Results next week regarding your portfolio.
This article is a continuation of last week’s post: Navigating Election Uncertainty: Should You Sell, Hold, or Buy More Stocks?
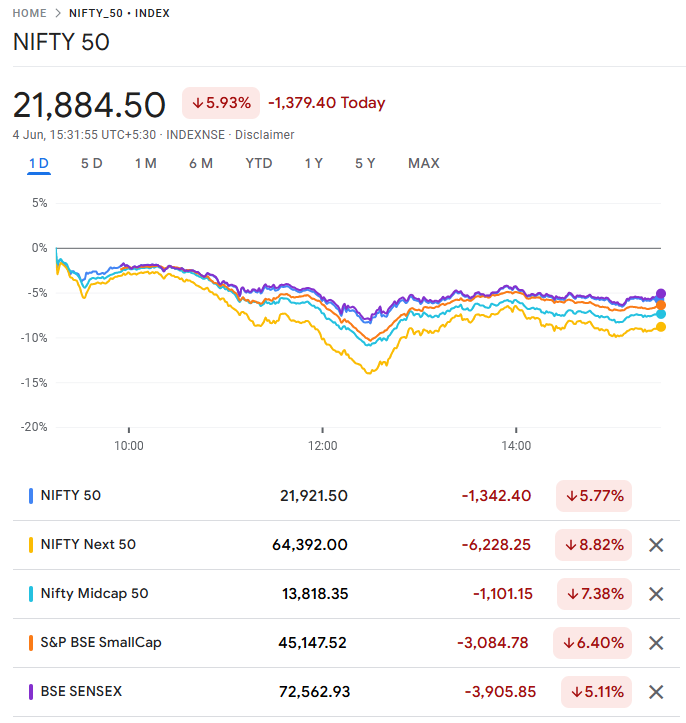
On 4th June 2024, we saw volatility that we had not seen since the wild fluctuations in March 2020 (12.98% fall in the Nifty 50 on 23-Mar-2020) during the COVID-19 crisis.
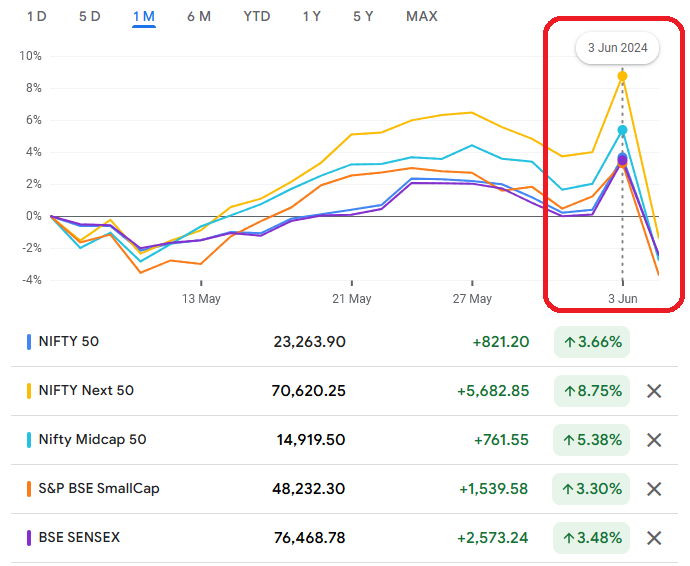
This market event follows the market movement of 3rd June 2024 when both the Nifty 50 and SENSEX touched lifetime highs.
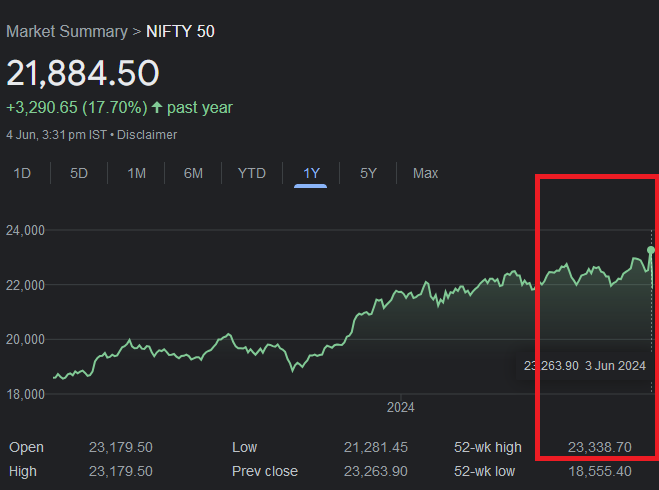
Interestingly, considering the closing price of 22,530.70 of the Nifty 50 on Friday 31st May, the closing price of Tuesday 4th June of 21,884.50 is just 2.86% lower. That is a very common occurrence. It is just the yo-yo behaviour on Monday and Tuesday that is uncommon and needs something like election results day to happen.
What does this mean for your portfolio and how do you deal with portfolio risk?
In the context of your portfolio, we need to understand what risk is vs. volatility:
Risk: you cannot meet your goal
Volatility: your portfolio value goes up and down
What the stock market demonstrated on the 3rd and 4th of June 2024, a sharp rise followed by a sharper fall is a classic example of volatility.
If the stock market keeps falling and does not recover for the next few months/years, it can create risk in your portfolio. If you were planning to sell equity for some goal (house purchase, college admission fees, retirement expenses and are forced to sell equity at a low level then that is a risk.
Why?
Forced selling at low levels is a permanent loss of capital. Volatility is a changing number on a screen or printed on your portfolio statement. Risk is being unable to buy a 3-BHK house, and settling for a 2-BHK house since the stock markets fell 20% when you needed to pay the seller.
To understand what you should do if your portfolio has fallen a lot:
A lot of traditional (print/books) and social media (YouTube/X/Facebook) espouse that small caps are riskier than mid-cap which are in turn riskier than large caps.
That is true from a theoretical perspective.
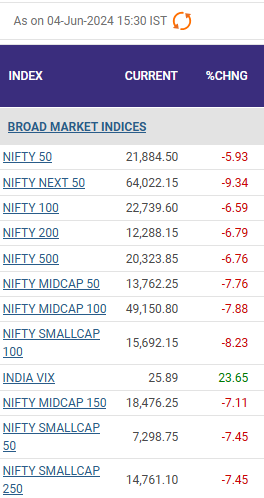
But, real life throws up certain curveballs like the Nifty Next 50 index (consisting of the 51st to 100th largest stocks, as per free-float market capitalisation) falling more than the Small Cap 250 index.
However, many investors have not seen this level of volatility since 23-Mar-2020 when the market fell by 12.98% as the below table (for trading since 23-Mar-2020) shows for the worst 10 one-day falls:
| Worst 1D fall | Date |
|---|---|
| -12.98% | 23-Mar-20 |
| -5.93% | 04-Jun-24 |
| -5.74% | 04-May-20 |
| -4.78% | 24-Feb-22 |
| -4.38% | 30-Mar-20 |
| -4.00% | 01-Apr-20 |
| -3.76% | 26-Feb-21 |
| -3.53% | 12-Apr-21 |
| -3.43% | 18-May-20 |
| -3.14% | 21-Dec-20 |
Depending on your experience of bear markets and associated volatility, you will react differently. In fact, this was the 29th worse 1-day fall since 1990 using the same dataset.
| Row | Worst 1D fall | Date |
|---|---|---|
| 1 | -12.98% | 23-Mar-20 |
| 2 | -12.24% | 17-May-04 |
| 3 | -12.20% | 24-Oct-08 |
| 4 | -11.77% | 28-Apr-92 |
| 5 | -11.07% | 12-May-92 |
| 6 | -8.70% | 21-Jan-08 |
| 7 | -8.54% | 06-May-92 |
| 8 | -8.46% | 31-Mar-97 |
| 9 | -8.30% | 12-Mar-20 |
| 10 | -7.87% | 28-Oct-97 |
| 11 | -7.87% | 14-May-04 |
| 12 | -7.61% | 16-Mar-20 |
| 13 | -7.43% | 11-May-92 |
| 14 | -7.42% | 17-Apr-99 |
| 15 | -7.09% | 05-Oct-98 |
| 16 | -7.07% | 15-Oct-90 |
| 17 | -6.95% | 04-Apr-00 |
| 18 | -6.77% | 18-May-06 |
| 19 | -6.66% | 11-Nov-08 |
| 20 | -6.65% | 10-Oct-08 |
| 21 | -6.48% | 11-Oct-90 |
| 22 | -6.43% | 10-Mar-92 |
| 23 | -6.32% | 12-Nov-90 |
| 24 | -6.31% | 07-Mar-91 |
| 25 | -6.18% | 07-Jan-09 |
| 26 | -6.11% | 13-Mar-01 |
| 27 | -5.96% | 17-Oct-08 |
| 28 | -5.94% | 22-Jan-08 |
| 29 | -5.93% | 04-Jun-24 |
| 30 | -5.91% | 24-Aug-15 |
The above discussion brings out the point of portfolio reviews.
“If a tree falls in a forest and no one is around to hear it, does it make a sound?” is a philosophical thought experiment that raises questions regarding observation and perception. (Wikipedia)
Similarly,
If you didn’t check your portfolio value on 4th June, did it really fall?
Or rather, if you didn’t know your portfolio value on this date, did it change anything regarding your long-term goals?
Therefore, it comes to the individual investor’s own perspective and risk appetite. You need to decide if:
For those investors who want to make a quick buck off such market movement, and have a bit of cash available, buying ETFs, which move up and down closely tracking the indices, can be an option. Only do this if the ETF is trading close to iNAV. As the screenshot below shows, the best ETFs are those which traded closest to the underlying Nifty 50 index and closed closest to -5.93%. The others should be avoided.
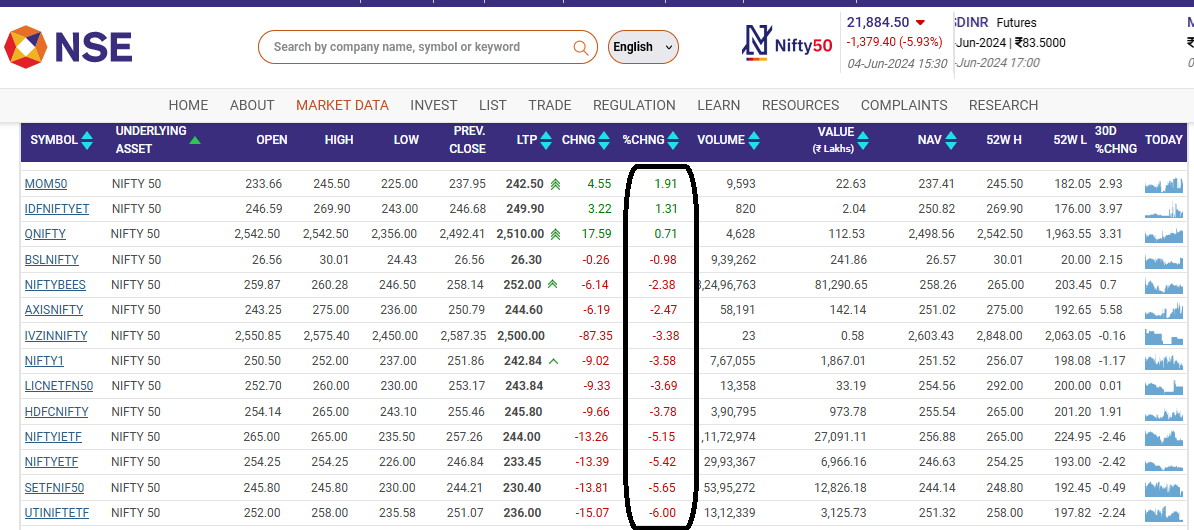
You cannot do the same in mutual funds since you will, in the best case, get the same-day NAV only if money reaches the AMC by 3 pm. Otherwise, you will get the next day’s NAV.
At any time, if you panic and sell your shares or mutual funds, you will convert a paper loss (measured by volatility) into a real risk.
This is the important point:
Here is a follow-up post on this topic: Worst mutual funds of 4th June 2024: which mutual funds fell the most on election results day?

Published: 18 December 2025
8 MIN READ
1. Email me with any questions.
2. Use our goal-based investing template to prepare a financial plan for yourself.Don't forget to share this article on WhatsApp or Twitter or post this to Facebook.
Discuss this post with us via Facebook or get regular bite-sized updates on Twitter.
More posts...Disclaimer: Content on this site is for educational purpose only and is not financial advice. Nothing on this site should be construed as an offer or recommendation to buy/sell any financial product or service. Please consult a registered investment advisor before making any investments.
This post titled 5.93% Fall in the Nifty: What Does Election Result Day Teach Us about Risk in Our Portfolio? first appeared on 05 Jun 2024 at https://arthgyaan.com