Arthgyaan

Supporting everyone's personal finance journey

How many bear markets have we seen in India?

This article gives you a brief history of bear markets in India, where the stock market has fallen by 20% or more and has taken some time to recover.

How many bear markets have we seen in India?


Posted on 05 Feb 2023
Author: Sayan Sircar
4 mins read
šŸ“¢Get new post notifications on WhatsApp!

This article gives you a brief history of bear markets in India, where the stock market has fallen by 20% or more and has taken some time to recover.

How many bear markets have we seen in India?

šŸ“š Topics covered:

What is a bear market?

SENSEX and bear markets

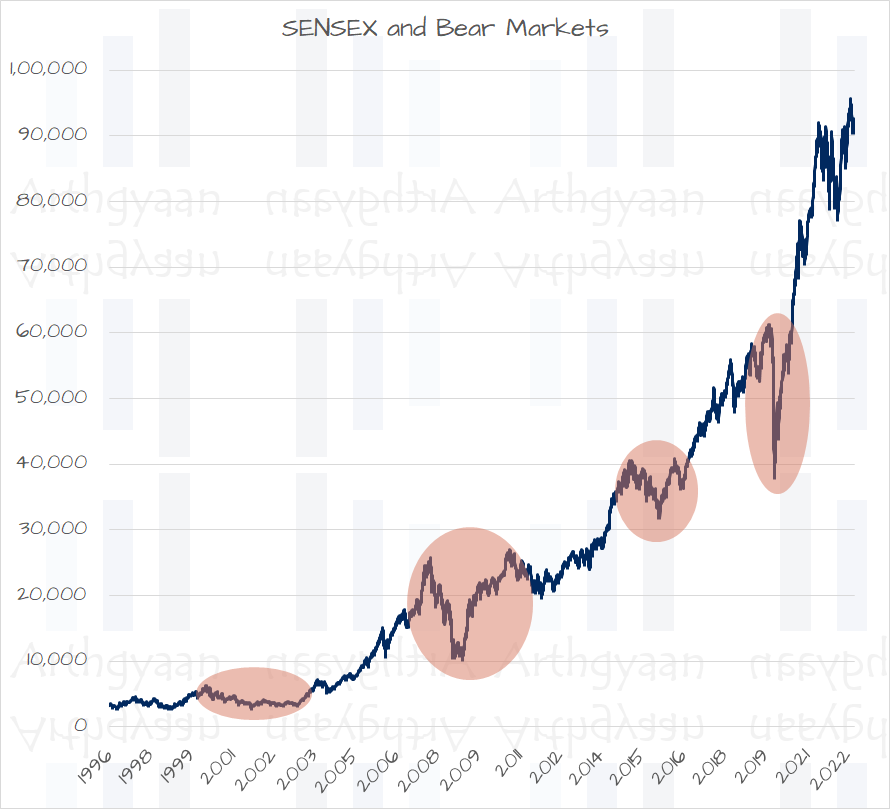
A bear market is a 20% or more fall in the stock market from a peak followed by a recovery lasting months. Knowing about bear markets is vital since it allows us to plan for worse-case scenarios. In addition, historical data can tell us how long an average bear market lasts, recovers and reaches the previous level.

This knowledge is critical to ensure that the asset allocation of our goals is such that we do not need to sell equity assets to fund a planned expenditure before the market can recover.

We have a shorter stock market history in India than in the US. This article will use data from the SENSEX Total Return Index (SENSEX TRI), which is BSE SENSEX 30 price plus dividends reinvested data, to study bear markets in India. We used Sensex price index data for the Harshad Mehta scam in 1992 since TRI data was unavailable.

Recent articles:
1 / 3
<p>As the market keeps rising to new all-time high figures, how much returns should equity investors expect from their investments running in SIP form.</p>
2 / 3
<p>This article discusses an alternative retirement portfolio construction method for generational wealth transfer.</p>
3 / 3
<p>This article gives the solution for buying small amounts of gold over the years in case buying SGB is not an option.</p>

Join the Arthgyaan WhatsApp community: You can stay updated on our latest content and learn about our webinars. Our community is fully private so that no one, other than the admin, can see your name or number. Also, we will not spam you.

Anatomy of a bear market

A bear market is defined as a 20% or more fall from a recent market peak. The peak leads to a trough followed by a recovery where the same index level as the peak is reached.

. Using the March COVID-19 example, we see the SENSEX TRI index reached:

  • peak: 61,231.45 on 14-Jan-20
  • trough: 38,017.16 on 23-Mar-20 (38% fall)
  • recovery: 61,873.26 on 06-Nov-2020 (recovery in 11 months)

Are these numbers typical? We see a few more examples below.

List of bear markets in India

List of bear markets in India

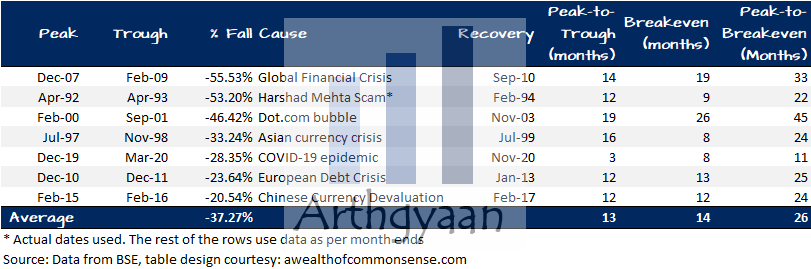
We are interested in three metrics:

  • how soon the bear market came after the market reached a peak: the average is 13 months or just more than a year
  • how deep was the fall: the average is around 37% which means that a retirement portfolio lost around a third of its longevity. Similar will be the impact on a portfolio in the accumulation stage, but at least in that case there is income available to make up the gap
  • how long did it take for the market to recover: the average number is 26 months or just more than two years but we need to keep in mind that this 26 months saw zero returns from the equity portfolio in case there was no SIP or lumpsum contribution (market timing/rebalancing) in the middle when the market was down. We are more interested in the 45 months worst case scenario to ensure we exit equity before that to maximize the chance of reaching our goal

A word of caution: when to exit equity as the goal comes close

Just because the worst recovery duration has been 45 months so far, it does not mean that the worst in the future will always be less than 4 years. We do not know what kind of financial crises will come in the future and how long they will last.

(click to open in a new tab)
Sample strategic asset allocation

Our asset allocation model for goal-based investing, therefore, errs on the side of caution and completely exits equity before 4 years in the most aggressive risk profile case and before 6 years in the most conservative case.

Related:
Your portfolio needs a glide path: what, why and how?

For investors with the intermediate risk profile, we recommend exiting equity when the goal is 5 years or closer.

What's next? You can join the Arthgyaan WhatsApp community

You can stay updated on our latest content and learn about our webinars. Our community is fully private so that no one, other than the admin, can see your name or number. Also, we will not spam you.

If you liked this article, please leave us a rating

The following button will take you to Trustpilot:

Discover an article from the archives

Worked out case studies for goal-based investing

Previous and next articles:

<p>This article gives you the latest view on target maturity debt funds for investors in 2023.</p>
Choosing Investments Mutual Funds
What are the best target maturity debt funds in 2023?

This article gives you the latest view on target maturity debt funds for investors in 2023.

Published: 1 February 2023

5 MIN READ


<p>This article lists mutual funds with the worst historical performance over 3, 5, 10, 15, and 20 years.</p>
Portfolio Review Mutual Funds
Are you invested in these worst-performing mutual funds?

This article lists mutual funds with the worst historical performance over 3, 5, 10, 15, and 20 years.

Published: 8 February 2023

3 MIN READ


Latest articles:

<p>This article shows how an investor should invest a lump sum amount in the stock market when the market has reached an all time high.</p>
Market Movements
How to invest a lump sum amount when the stock market is at an all-time high?

This article shows how an investor should invest a lump sum amount in the stock market when the market has reached an all time high.

Published: 10 December 2023

4 MIN READ


<p>As the market keeps rising to new all-time high figures, how much returns should equity investors expect from their investments running in SIP form.</p>
Market Movements
Nifty above 21000: what should you do with your equity SIPs? Start, stop or continue?

As the market keeps rising to new all-time high figures, how much returns should equity investors expect from their investments running in SIP form.

Published: 8 December 2023

3 MIN READ


Topics you will like:

Asset Allocation (20) Basics (8) Behaviour (10) Budgeting (11) Calculator (17) Case Study (6) Children (14) Choosing Investments (40) FAQ (7) FIRE (13) Gold (14) Health Insurance (4) House Purchase (21) Insurance (15) International Investing (10) Life Stages (2) Loans (13) Market Movements (17) Mutual Funds (34) NPS (6) NRI (15) News (10) Pension (8) Portfolio Construction (47) Portfolio Review (27) Reader Questions (6) Real Estate (6) Retirement (38) Review (13) Risk (6) Safe Withdrawal Rate (5) Set Goals (27) Step by step (15) Tax (43)

Next steps:

1. Email me with any questions.

2. Use our goal-based investing template to prepare a financial plan for yourself
OR
use this quick and fast online calculator to find out the SIP amount and asset allocation for your goals.

Don't forget to share this article on WhatsApp or Twitter or post this to Facebook.

Discuss this post with us via Facebook or get regular bite-sized updates on Twitter.

More posts...

Disclaimer: Content on this site is for educational purpose only and is not financial advice. Nothing on this site should be construed as an offer or recommendation to buy/sell any financial product or service. Please consult a registered investment advisor before making any investments.

This post titled How many bear markets have we seen in India? first appeared on 05 Feb 2023 at https://arthgyaan.com


We are currently at 327 posts and growing fast. Search this site:
Copyright Ā© 2021-2023 Arthgyaan.com. All rights reserved.