Are We in a Bear Market? What is Mutual Fund Performance Data telling us?
This article explores the signals from the mutual fund market to see if we are currently in or approaching a bear market in India.
This article explores the signals from the mutual fund market to see if we are currently in or approaching a bear market in India.

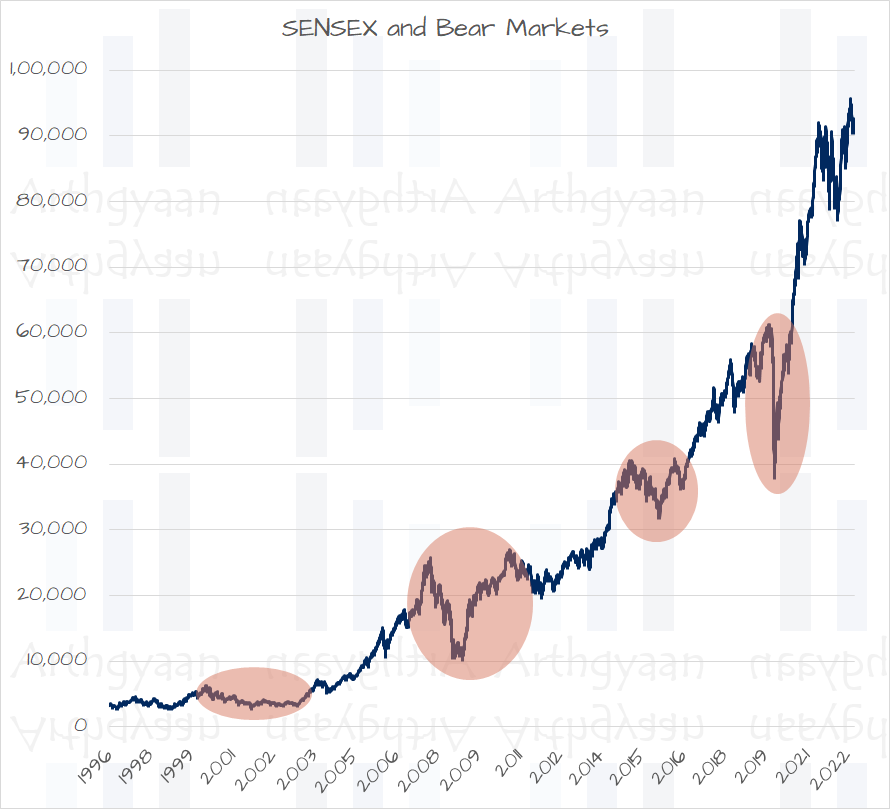
A bear market is a 20% or more fall in the stock market from a peak followed by a recovery lasting months.
Right now, the SENSEX and the Nifty 50 are trading far from the 20% fall mark from their 52-week highs. The best indicator is the Nifty Total Market Index which does not indicate a bear market.
We believe that a practical approach to understanding whether or not we are in a bear market will be helpful to investors. We use data from equity mutual funds to check if these funds have fallen 20% (bear territory) or close to a 20% fall (near bear territory) from their 52-week highs. We are choosing the 52-week high as the peak for the sole reason that the lifetime highs of most of the indices in India have taken place in the last 12 months. In the cases where 52-week hgih was not the lifetime high, we have gone back two years.
If you want to know more about the performance of your mutual funds, you can get a free Mutual Fund Portfolio review.
Since indices are not investible we will first look at the indication from individual mutual funds. The complete universe of mutual funds is a valid proxy for the entire stock market.
We are using NAV and Fund Categorisation data from AMFI to create the table below. The average is a simple arithmetic average and is not weighted by AuM. Market data is for the period ending 24-Jan-2025
| Category | Average Fall | Funds # | Bear Funds | Near Bear Funds |
|---|---|---|---|---|
| All Equity Funds | -10.98% | 786 | 20 | 105 |
| Contra | -11.82% | 3 | 0 | 0 |
| Dividend Yield | -12.45% | 10 | 0 | 0 |
| Elss | -12.23% | 43 | 0 | 5 |
| Flexi Cap | -12.16% | 40 | 0 | 4 |
| Focused | -12.72% | 29 | 1 | 2 |
| Large & Mid Cap | -11.99% | 31 | 0 | 1 |
| Large Cap | -12.04% | 33 | 0 | 1 |
| Mid Cap | -12.73% | 30 | 0 | 3 |
| Multi Cap | -11.99% | 29 | 0 | 1 |
| Sectoral Thematic | -12.27% | 205 | 5 | 48 |
| Small Cap | -13.35% | 29 | 0 | 5 |
| Value | -12.16% | 20 | 0 | 2 |
| Index Funds | -8.62% | 284 | 14 | 33 |
Here there is one caveat that the fund category, as defined by AMFI, contains both market-capitalisation weighted funds (like the Nifty 50 and Nifty Next 50 trackers) as well as factor (like low volatility) funds.
These mutual funds have fallen 20% or more from their 52-week high.
| Category | Fund | Return |
|---|---|---|
| Sectoral Thematic | Tata Infrastructure | -21.10% |
| Focused | Motilal Oswal Focused 25 | -20.82% |
| Index Funds | UTI Nifty 200 Momentum 30 Index | -21.23% |
| Index Funds | Motilal Oswal Nifty 200 Momentum 30 Index | -21.40% |
| Index Funds | ICICI Prudential Nifty 200 Momentum 30 Index | -21.51% |
| Index Funds | BANDHAN NIFTY200 MOMENTUM 30 INDEX | -21.46% |
| Sectoral Thematic | HDFC Defence | -22.33% |
| Index Funds | Kotak Nifty 200 Momentum 30 Index | -21.49% |
| Sectoral Thematic | Aditya Birla Sun Life Transportation and Logistics | -20.74% |
| Index Funds | Bandhan Nifty Alpha 50 Index | -20.38% |
| Sectoral Thematic | quant PSU | -22.86% |
| Index Funds | HDFC NIFTY200 Momentum 30 Index | -21.61% |
| Index Funds | HDFC NIFTY Realty Index | -25.80% |
| Index Funds | Tata Nifty Realty Index | -25.76% |
| Sectoral Thematic | SBI Automotive Opportunities | -21.03% |
| Index Funds | Motilal Oswal Nifty India Defence Index | -26.58% |
| Index Funds | Tata Nifty200 Alpha 30 Index | -20.09% |
| Index Funds | Motilal Oswal Nifty 500 Momentum 50 Index | -21.28% |
| Index Funds | Nippon India Nifty 500 Momentum 50 Index | -21.37% |
| Index Funds | Nippon India Nifty Realty Index | -23.66% |
| Fund | Return |
|---|---|
| Invesco India PSU Equity | -19.95% |
| Samco Special Opportunities | -19.91% |
| SBI Energy Opportunities | -19.69% |
| Aditya Birla Sun Life PSU Equity | -19.64% |
| UTI-Transpotation and Logistics | -18.92% |
| BANDHAN Infrastructure | -18.37% |
| BANDHAN TRANSPORTATION AND LOGISTICS | -18.01% |
| Edelweiss Business Cycle | -17.94% |
| quant Business Cycle | -17.85% |
| quant Manufacturing | -17.56% |
| Tata Housing Opportunities | -17.53% |
| quant Infrastructure | -17.14% |
| HDFC Transportation and Logistics | -17.14% |
| quant BFSI | -17.01% |
| SBI PSU | -16.98% |
| UTI India Consumer | -16.90% |
| Aditya Birla Sun Life Quant | -16.84% |
| Kotak Quant | -16.81% |
| Mirae Asset Great Consumer | -16.77% |
| quant Commodities | -16.74% |
| DSP India T.I.G.E.R. | -16.73% |
| Mahindra Manulife Consumption | -16.73% |
| quant ESG Equity | -16.60% |
| quant Quantamental | -16.43% |
| ICICI PRUDENTIAL TRANSPORTATION AND LOGISTICS | -16.28% |
| HDFC Housing Opportunities | -16.25% |
| ICICI Prudential PSU Equity | -16.15% |
| Motilal Oswal Manufacturing | -16.08% |
| HDFC MNC | -16.04% |
| Taurus Infrastructure | -16.03% |
| Nippon India Power & Infra | -15.96% |
| SBI Magnum COMMA | -15.91% |
| Bank of India Business Cycle | -15.85% |
| Bank of India Business Cycle | -15.85% |
| HDFC Non-Cyclical Consumer | -15.83% |
| 360 ONE QUANT | -15.82% |
| quant Momentum | -15.63% |
| Nippon India Consumption | -15.56% |
| Aditya Birla Sun Life India Gennext | -15.47% |
| Motilal Oswal Business Cycle | -15.46% |
| HSBC Infrastructure | -15.39% |
| quant Consumption | -15.33% |
| Kotak Infrastructure & Economic Reform | -15.27% |
| UTI Infrastructure | -15.14% |
| DSP Natural Resources and New Energy | -15.06% |
| Mahindra Manulife Manufacturing | -15.04% |
| CANARA ROBECO CONSUMER TRENDS | -15.03% |
| Nippon India Innovation | -15.01% |
| Fund | Return |
|---|---|
| Aditya Birla Sun Life Small Cap | -15.73% |
| Mahindra Manulife Small Cap | -15.67% |
| BANK OF INDIA Small Cap | -15.59% |
| quant Small Cap | -15.21% |
| Baroda BNP Paribas Small Cap | -15.09% |
| Fund | Return |
|---|---|
| Quant Value | -15.84% |
| JM Value | -15.31% |
| Fund | Return |
|---|---|
| Baroda BNP Paribas Nifty200 Momentum 30 Index | -19.90% |
| ICICI Prudential Nifty Next 50 Index | -19.79% |
| HDFC NIFTY Next 50 Index | -19.78% |
| Aditya Birla Sun Life Nifty Next 50 Index | -19.77% |
| ICICI Prudential Nifty Auto Index | -19.77% |
| DSP Nifty Next 50 Index | -19.75% |
| Tata Nifty Auto Index | -19.72% |
| HSBC NIFTY NEXT 50 INDEX | -19.69% |
| SBI Nifty Next 50 Index | -19.61% |
| UTI Nifty Next 50 Index | -19.56% |
| LIC MF Nifty Next 50 Index | -19.52% |
| Edelweiss Nifty Next 50 Index | -19.51% |
| Motilal Oswal Nifty Next 50 Index | -19.50% |
| Axis Nifty Next 50 Index | -19.46% |
| Kotak Nifty Next 50 Index | -19.43% |
| Navi Nifty Next 50 Index | -19.37% |
| Bandhan Nifty 500 Momentum 50 Index | -18.54% |
| Kotak BSE PSU Index | -18.25% |
| DSP Nifty Smallcap250 Quality 50 Index | -17.64% |
| Nippon India Nifty Alpha Low Volatility 30 Index | -17.48% |
| Edelweiss Nifty Alpha Low Volatility 30 Index | -17.40% |
| Groww Nifty Non-Cyclical Consumer Index | -16.83% |
| Motilal Oswal BSE Enhanced Value Index | -16.78% |
| Motilal Oswal BSE Quality Index | -16.56% |
| Navi Nifty India Manufacturing Index | -16.47% |
| UTI Nifty 500 Value 50 Index | -16.46% |
| HDFC Nifty 100 Equal Weight Index | -15.84% |
| Kotak BSE Housing Index | -15.60% |
| UTI BSE Housing Index | -15.58% |
| Sundaram Nifty 100 Equal Weight | -15.48% |
| Edelweiss Nifty500 Multicap Momentum Quality 50 Index | -15.44% |
| Tata Nifty Midcap 150 Momentum 50 Index | -15.41% |
| Edelweiss Nifty Midcap150 Momentum 50 Index | -15.25% |
| Fund | Return |
|---|---|
| quant Active | -16.54% |
| Fund | Return |
|---|---|
| BARODA BNP PARIBAS Focused | -15.23% |
| quant Focused | -15.19% |
| Fund | Return |
|---|---|
| quant Mid Cap | -15.75% |
| HSBC Midcap | -15.63% |
| Motilal Oswal Midcap | -15.24% |
| Fund | Return |
|---|---|
| NJ Flexi Cap | -17.84% |
| quant Flexi Cap | -17.18% |
| Shriram Flexi Cap | -16.13% |
| Samco Flexi Cap | -15.34% |
| Fund | Return |
|---|---|
| quant ELSS Tax Saver | -18.56% |
| ITI ELSS Tax Saver | -17.30% |
| Samco ELSS Tax Saver | -16.74% |
| Motilal Oswal ELSS Tax Saver | -16.70% |
| Shriram ELSS Tax Saver | -15.77% |
| Fund | Return |
|---|---|
| PGIM India Large Cap | -12.48% |
| Fund | Return |
|---|---|
| Motilal Oswal Large and Midcap | -15.02% |
Any funds not in the lists above have not fallen more than 15% from the 52-week high.
If we look at the broad indices themselves, we are considerably far from a bear market.
| Type | Count | Bear | Near Bear |
|---|---|---|---|
| Sector/Thematic | 15 | 2 | 5 |
| Market Cap | 14 | 0 | 1 |
| Factor | 16 | 2 | 7 |
| Total | 45 | 4 | 13 |
| Index | Fall from 52-week high | Bear? |
|---|---|---|
| NIFTY NEXT 50 | -19.60% | Near Bear |
| NIFTY SMALLCAP 50 | -14.28% | Neither |
| NIFTY SMALLCAP 250 | -14.17% | Neither |
| NIFTY 50 EQUAL WEIGHT | -14.11% | Neither |
| NIFTY MICROCAP 250 | -13.97% | Neither |
| S&P BSE 500 | -13.10% | Neither |
| NIFTY 100 | -13.06% | Neither |
| NIFTY TOTAL MARKET | -12.87% | Neither |
| NIFTY 500 | -12.84% | Neither |
| NIFTY MIDCAP 50 | -12.76% | Neither |
| NIFTY LARGE MIDCAP 250 | -12.44% | Neither |
| NIFTY MIDCAP 150 | -12.43% | Neither |
| NIFTY 50 | -11.76% | Neither |
| SENSEX | -11.11% | Neither |
Quite a few sectoral indices are close to the bear category.
| Index | Fall from 52-week high | Bear? |
|---|---|---|
| NIFTY DEFENCE | -26.58% | Bear |
| NIFTY REALTY | -25.78% | Bear |
| NIFTY AUTO | -19.74% | Near Bear |
| S&P BSE PSU | -18.25% | Near Bear |
| NIFTY NON-CYCLICAL CONSUMER | -16.83% | Near Bear |
| NIFTY MANUFACTURING | -16.47% | Near Bear |
| S&P BSE HOUSING | -15.59% | Near Bear |
| S&P BSE FINANCIALS EX BANK 30 | -14.47% | Neither |
| NIFTY FINANCIAL SERVICES EX-BANK | -12.74% | Neither |
| NIFTY BANK | -11.10% | Neither |
| NIFTY FINANCIAL SERVICES | -10.67% | Neither |
| NIFTY TOURISM | -9.77% | Neither |
| NIFTY MIDSMALL HEALTHCARE | -9.44% | Neither |
| NIFTY PHARMA | -8.16% | Neither |
| NIFTYIT | -4.93% | Neither |
The same is true with the factor indices as well.
| Index | Fall from 52-week high | Bear? |
|---|---|---|
| NIFTY200 MOMENTUM 30 | -21.45% | Bear |
| NIFTY ALPHA 50 | -20.38% | Bear |
| NIFTY SMALLCAP250 QUALITY 50 | -17.64% | Near Bear |
| NIFTY ALPHA LOW VOLATILITY 30 | -17.44% | Near Bear |
| S&P BSE ENHANCED VALUE | -16.78% | Near Bear |
| S&P BSE QUALITY | -16.56% | Near Bear |
| NIFTY 500 VALUE 50 | -16.46% | Near Bear |
| NIFTY 100 EQUAL WEIGHT | -15.66% | Near Bear |
| NIFTY MIDCAP 150 MOMENTUM 50 | -15.33% | Near Bear |
| NIFTY50 EQUAL WEIGHT | -14.15% | Neither |
| NIFTY 100 QUALITY 30 | -13.32% | Neither |
| S&P BSE LOW VOLATILITY | -12.66% | Neither |
| NIFTY 100 LOW VOLATILITY 30 | -12.09% | Neither |
| NIFTY100 LOW VOLATILITY 30 | -12.09% | Neither |
| NIFTY MIDCAP 150 QUALITY 50 | -11.30% | Neither |
| NIFTY 50 VALUE 20 | -9.70% | Neither |
Investors should either revisit their plan to invest in sectoral/thematic or factor funds or use this opportunity to enter these funds based on their conviction.
There are generally three takeaways from data like this:

1. Email me with any questions.
2. Use our goal-based investing template to prepare a financial plan for yourself.Don't forget to share this article on WhatsApp or Twitter or post this to Facebook.
Discuss this post with us via Facebook or get regular bite-sized updates on Twitter.
More posts...Disclaimer: Content on this site is for educational purpose only and is not financial advice. Nothing on this site should be construed as an offer or recommendation to buy/sell any financial product or service. Please consult a registered investment advisor before making any investments.
This post titled Are We in a Bear Market? What is Mutual Fund Performance Data telling us? first appeared on 13 Jan 2025 at https://arthgyaan.com