Is there a correction in the stock markets?
A stock market correction happens frequently. Here is how you anticipate and deal with one.
A stock market correction happens frequently. Here is how you anticipate and deal with one.
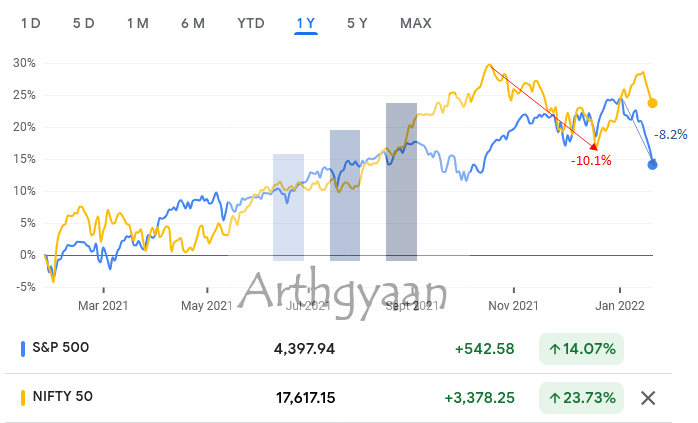
A bull market, correction, bear market and recovery form a part of the usual market cycle. A lot of new investors who entered the stock markets since mid-2020 recently experienced their first correction when the Nifty 50 closed 10.1% lower on 20-Dec-2021 compared to the lifetime high of 18477.05 on 18-Oct-2021.
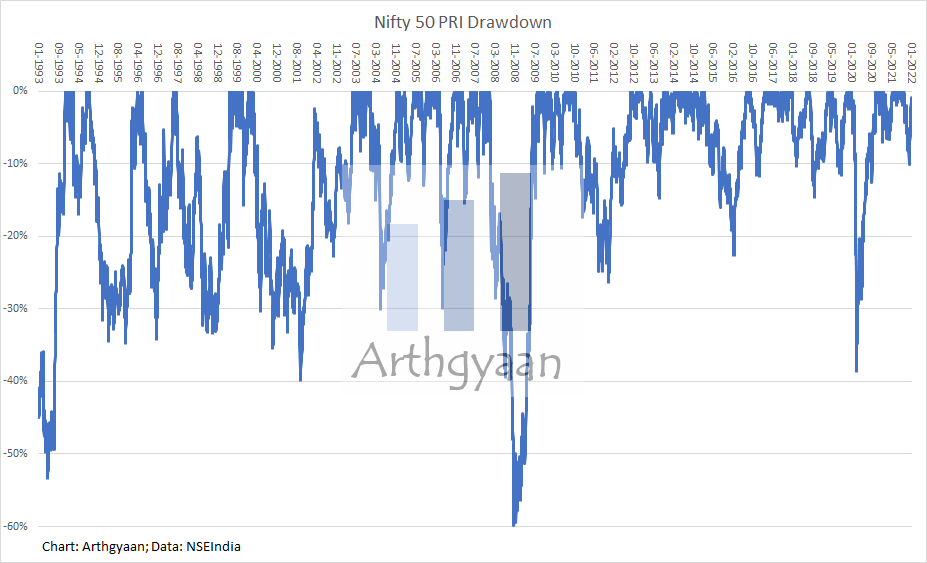
A correction is defined as a fall of 10% or more from a recent peak and they do happen fairly often. Here is a Nifty 50 price index chart from 1993 that shows the drawdowns, i.e. the fall from a peak in the last year. The point of this article is to provide some guidance to investors without a lot of experience with how markets behave.
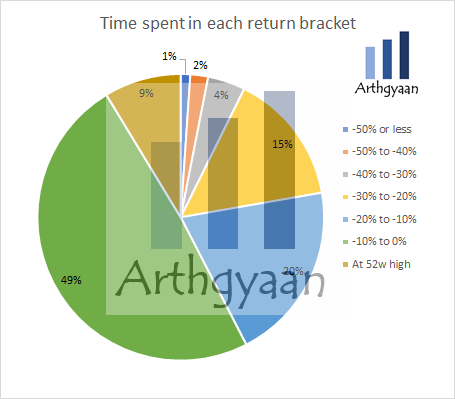
We have taken Nifty 50 price data from NSEIndia.com since 1992 to calculate how long markets have been below the highest point reached in the last twelve months. Once we go the individual returns below the highest point, we have split these drawdown figures into 10% buckets. The results are:
over 7166 trading days which is more than 28 years.
As the pie chart shows the split of this data, we see that the market has been just below a 52-week high, not falling more than 10%, for 3503 days or 49% of the time. For another 622 days or 9% of the time, the market is reaching new 52-week highs. Combining the two results, we see that the market has not fallen more than 10% times, i.e. not undergoing a correction for around 60% of the time.
Since a correction is defined as a fall of 10% or more, this also means that the market is also in a state of perpetual correction 40% of the time. This information shows that investors should adjust their expectations that stock markets perpetually go up. Each correction period should be looked upon as a buying opportunity and not feared.
Over this period, we can use the drawdown chart to count the number of occurrences the market has breached each 10% band. For example, there have been
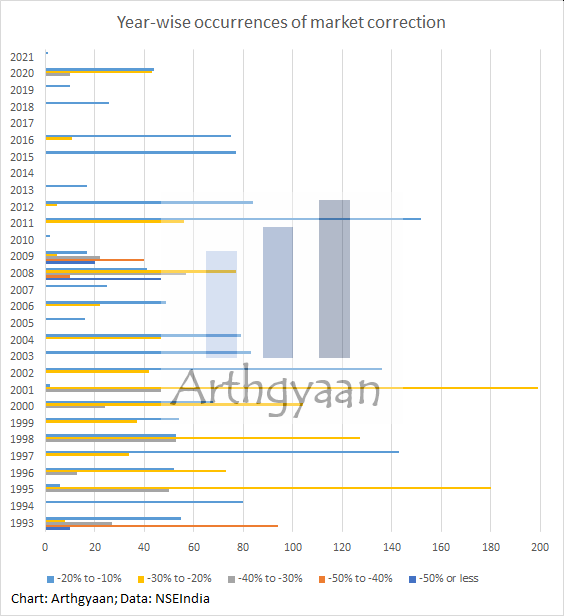
Since the data spans 28 years, we can conclude that:
A quick reminder on the concept of probability is useful here: this result has come from historical data. It will be good to expect a correction every 6 months or a massive 50% crash every 10 years but the actual occurrence of the event cannot be predicted in advance. If you get ideas, by looking at this data, for buying the dip, have a look at this post: Markets are falling. Should you buy the dip?
The next part will deal with what investors should do with this knowledge.
As we have shown in this previous post, What returns should we expect from equity investing?, we have estimated the returns you can get based on the holding period for lump sum and SIP investments. The risk, for example, a 30% fall every 2 years, has two implications:
The last point is discussed below.
These are the tools that help manage the risk of the portfolio irrespective of where the market is going:
We have previously covered before, what to do if the market is near all-time highs: Should you sell off your equity funds since the market is overvalued?
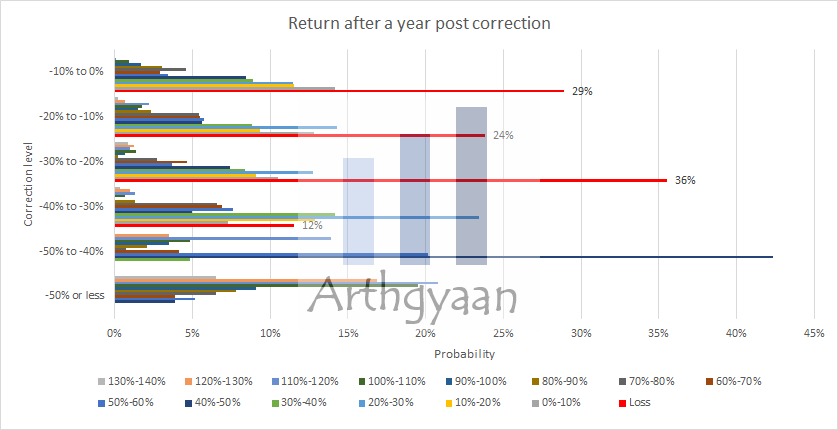
Now we will check the reverse i.e. what happens a year after a correction. We see above that the higher the fall, the more the chance that the market will recover after a year. Each cluster of bars, per bracket like -50%-40%, shows the total probability of each of the outcomes starting from loss to the maximum seen over this period in a year i.e. 140%. We have explicitly called out, in red, the probabilities where the market is at a loss after one year.
How investors should use this information:
We discuss the last point in the next section.
Rebalancing is a must if we need to take advantage of market corrections and subsequent recovery. Using a suitable asset allocation with debt, we can systematically buy low and sell high based on rebalancing rules. A common way to rebalance is to examine if the asset classes like equity and debt have breached a corridor like 5%. For example, you can rebalance whenever weights change by a fixed value, say 5% (e.g. 60:40 will be rebalanced whenever 65:35 or 55:45 happens) - the 5% value is a thumb rule that can be used as per current portfolio weights of various assets.
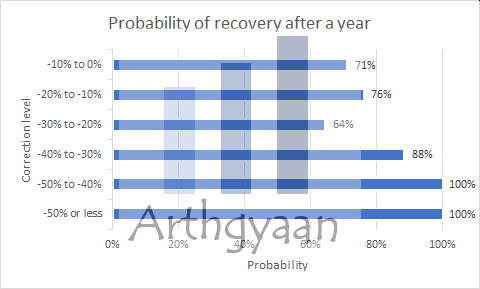
As the market breaches the zones, from 10% fall to 20% to 30% etc, the investment plan should be reviewed to decide if rebalancing is to be done or not.
The concept of rebalancing has been discussed in detail in this post: Portfolio rebalancing during goal-based investing: why, when and how?
Rebalancing counters the natural fear that comes once the market starts falling and prevents the negative impact of a wrong decision. Of course, the investor must have a goal-based investment plan in place which defines the asset allocation for each goal and that will decide what needs to be done once the correction happens. Read more here to get started with goal-based investing: I have just started earning and do not know a lot about finance. What now?.

Published: 23 December 2025
6 MIN READ

Published: 18 December 2025
8 MIN READ
1. Email me with any questions.
2. Use our goal-based investing template to prepare a financial plan for yourself.Don't forget to share this article on WhatsApp or Twitter or post this to Facebook.
Discuss this post with us via Facebook or get regular bite-sized updates on Twitter.
More posts...Disclaimer: Content on this site is for educational purpose only and is not financial advice. Nothing on this site should be construed as an offer or recommendation to buy/sell any financial product or service. Please consult a registered investment advisor before making any investments.
This post titled Is there a correction in the stock markets? first appeared on 24 Jan 2022 at https://arthgyaan.com
Copyright © 2021-2025 Arthgyaan.com. All rights reserved.