How much return do we expect from the stock market now that the elections are over?
This article uses historical data to estimate returns expected from the stock market post-election.
This article uses historical data to estimate returns expected from the stock market post-election.
This article is a part of our detailed article series on Election 2024 and the following market gyrations. Ensure you have read the other parts here:
This article discusses the strategies needed to profit off sudden market falls like that happened on election results day on 4th June 2024.
This article talks about the volatility in the stock market on 4th June 2024, which was the day of election results.
This article shows you the pros and cons of each approach you can take between today and the General Election Results next week regarding your portfolio.
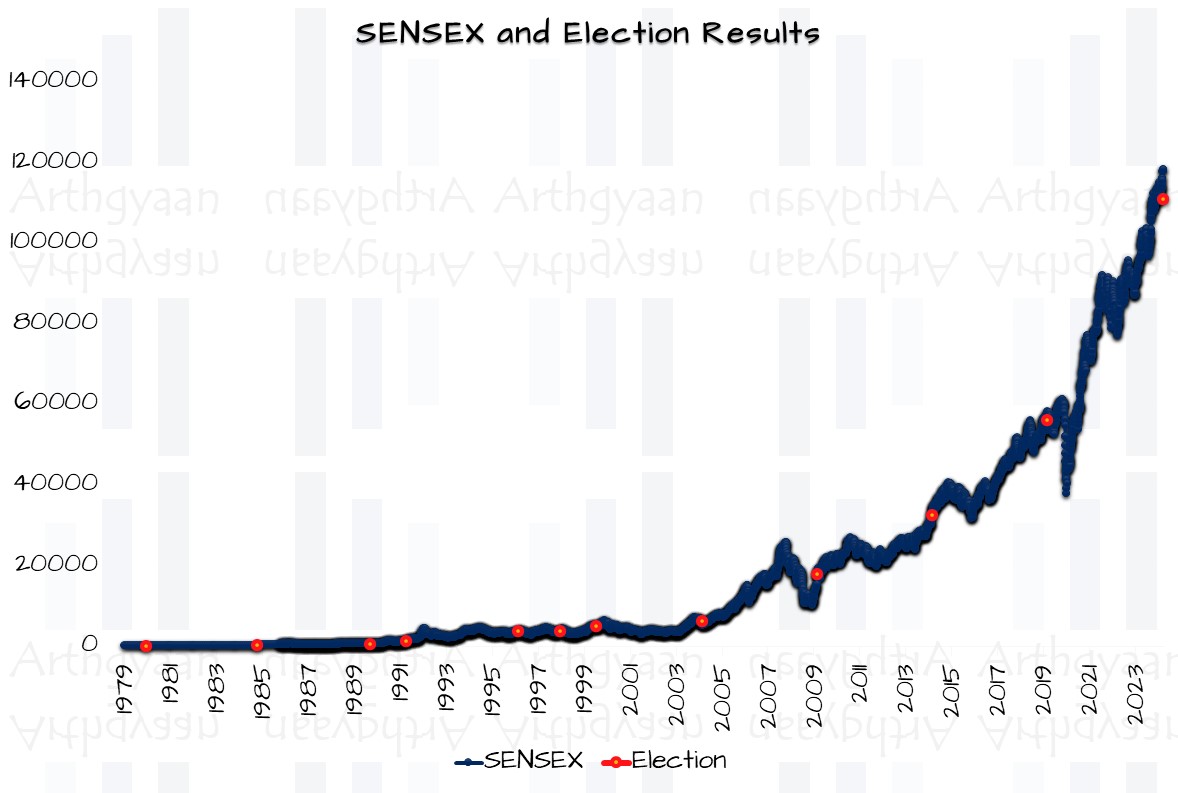
Stock trading started in India in 1875 with the “Native Share and Stock Broker’s Association” which later became the Bombay Stock Exchange (BSE). However, the SENSEX index with 30 stocks started in 1979 allowing us to measure the impact of election results on the stock market since the 7th Lok Sabha elections of Feb 1980.
| Election | Year | Result on |
|---|---|---|
| 7 | 1980 | Wed 06-Feb-80 |
| 8 | 1984-1985 | Sat 29-Dec-84 |
| 9 | 1989 | Mon 27-Nov-89 |
| 10 | 1991 | Sun 16-Jun-91 |
| 11 | 1996 | Wed 08-May-96 |
| 12 | 1998 | Tue 03-Mar-98 |
| 13 | 1999 | Wed 06-Oct-99 |
| 14 | 2004 | Thu 13-May-04 |
| 15 | 2009 | Sat 16-May-09 |
| 16 | 2014 | Fri 16-May-14 |
| 17 | 2019 | Thu 23-May-19 |
| 18 | 2024 | Tue 04-Jun-24 |
In this analysis, we will use the value of the SENSEX Total Return Index that shows the price change of the 30 SENSEX stocks (the usual SENSEX that you see everywhere) and reinvests the dividends from these stocks back into the index. This adjustment gives a complete picture of the returns for an investor who benefits from both stocks going up in price and the dividends they declare.
We are using the median (middle value from a list) instead of the average of the returns to avoid impacting the result due to extreme values in the 1980s to 1990. The charts below show the changes in the SENSEX index measured from the election result declaration day.
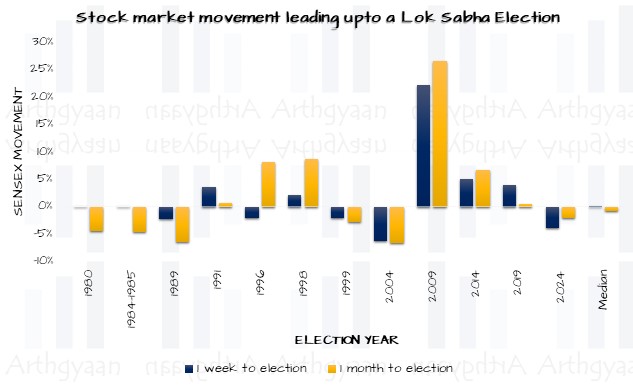
The chart indicates a trend of increased volatility in the stock market in the periods leading up to the Lok Sabha elections. Volatility can be a trader’s friend or that of the disciplined stock investor with a watchlist of stocks and spare capital.
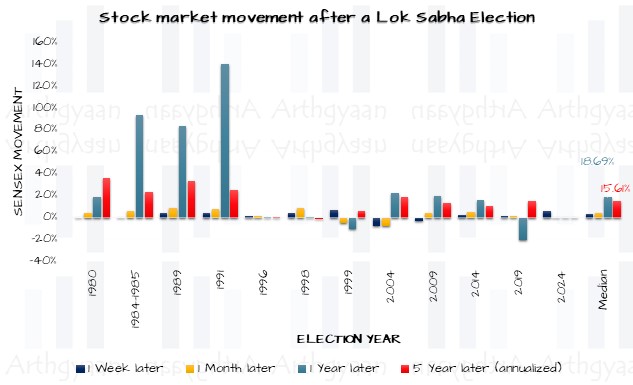
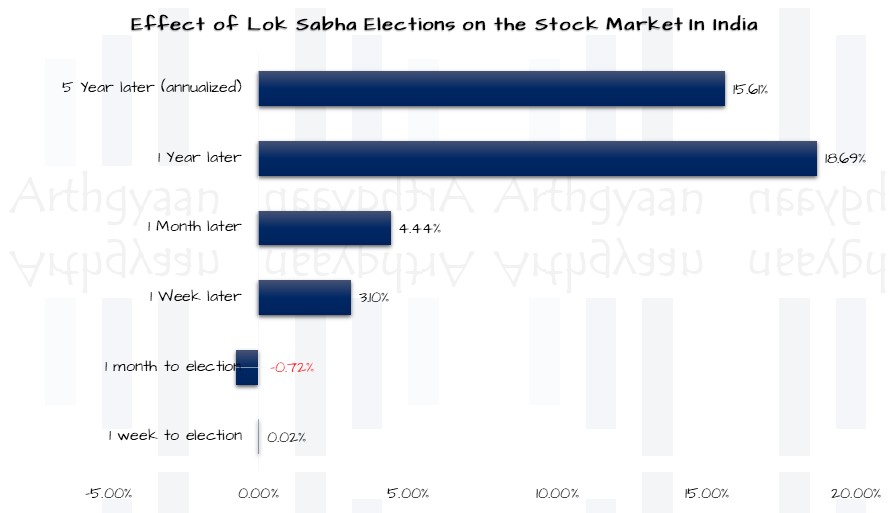
Stock markets are affected by elections more in the short term than in the long term. In the long term, the market prefers a stable government and consistent policies.
In the short term, both leading up to and post the elections, there will be considerable market volatility.
Long-term investors should take comfort in the India growth story and continue to invest as per their investment plan. The election period is nothing but a blip in the journey.

Published: 18 December 2025
7 MIN READ
1. Email me with any questions.
2. Use our goal-based investing template to prepare a financial plan for yourself.Don't forget to share this article on WhatsApp or Twitter or post this to Facebook.
Discuss this post with us via Facebook or get regular bite-sized updates on Twitter.
More posts...Disclaimer: Content on this site is for educational purpose only and is not financial advice. Nothing on this site should be construed as an offer or recommendation to buy/sell any financial product or service. Please consult a registered investment advisor before making any investments.
This post titled How much return do we expect from the stock market now that the elections are over? first appeared on 12 Jun 2024 at https://arthgyaan.com