Can you predict stock market returns based on past returns?
This article explores if short-term returns of the Nifty 50 allow you to predict future returns
 Market Movements
This article explores if short-term returns of the Nifty 50 allow you to predict future returns

My favourite stock market prediction quote is this one:
“Nobody can predict interest rates, the future direction of the economy or the stock market. Dismiss all such forecasts and concentrate on what’s actually happening to the companies in which you’ve invested.” - Peter Lynch (2012)
Just because prediction is difficult, especially that of the future (as Niels Bohr purportedly said), it does not mean that people won’t try to predict. It is, after all, an excellent business proposition trying to predict the stock market’s direction.
In this article, we will explore one easy-to-observe metric and try to use that for predicting short-term market movement.
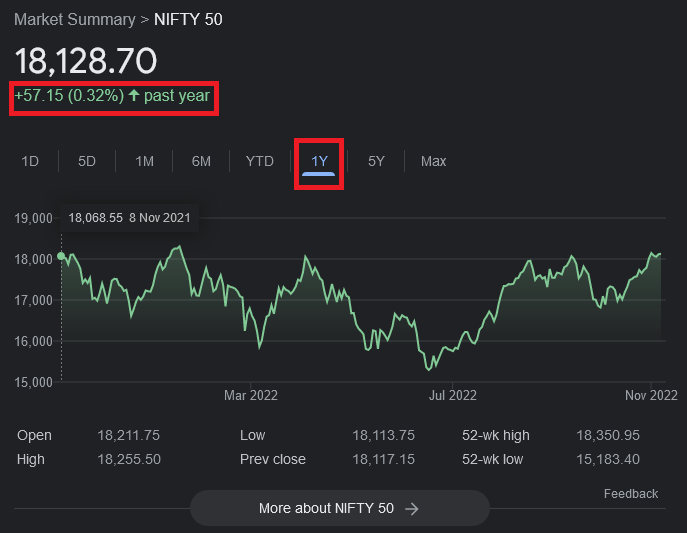
The return of a large-cap stock market index like the Nifty 50 can be easily found. You can click the image above to see the latest one-year trailing return for the index.
We will therefore use the trailing 1-year Nifty 50 return to predict the next 1-year Nifty 50 return.

First of all, this is not the map of the continental United States. It is instead a plot of the last 12 vs the next 12 months of Nifty 50 returns every day since 1994 until a year back. The window stops a year back since we are using 12 months of forward returns.
Any data point on the chart represents one trading day in this period and shows the last 12 months (X-axis) vs the next 12 months’ returns (Y-axis). We split the chart into four colour-coded quadrants based on profits and losses in either the last 12 or the next 12 months.
The pie chart on the top right shows how much time is distributed in the four quadrants. This pie chart shows probabilities and should be interpreted as such. For example, we see that in 46% of cases, every time the market has risen in the last 12 months, it has followed with a profitable 12 months in the following 1-year period. The light-blue cases are also good since we have a positive 1-year return following a negative year.
The reds and yellows are a cause of concern since they represent yearly losses. The red quadrant shows the cases of 1-year of losses following one negative year. These cases, basically two years of negative returns, are fortunately rare. The yellow one shows the case of a loss following one year of profit. The number of cases is fairly large since 21% represents that there are 1 out of 5 cases of losses following a year of profit.
At a high level, the probabilities are:
Profitable year = (Blues / Total) = (46+25)/100 = 71%
Loss making year = (Red + Yellow)/Total = (21+8)/100 = 29%
We already know the previous 1-year returns. We can use that to predict the forward return given whether we have just made a profit or a loss. If you remember school-level statistics, this is the concept of conditional probability:
In probability theory, conditional probability is a measure of the probability of an event occurring, given that another event has already occurred. - Wikipedia

The chart shows that:
We are trying to predict the future based on probabilities calculated using historical data. The stock market does not have any memory that can be used to predict the future. If we calculate a correlation of these returns (last 12 months vs. next 12 months) the number comes to -0.23. This number shows that the relationship is weak and the opposite result is generally expected.
We need to understand that:
Investors in the accumulation stage should be less concerned about short-term market movements and instead about whether they are investing enough for their goals. Retired investors should implement a bucket strategy and focus on rebalancing their corpus once a year.

1. Email me with any questions.
2. Use our goal-based investing template to prepare a financial plan for yourself.Don't forget to share this article on WhatsApp or Twitter or post this to Facebook.
Discuss this post with us via Facebook or get regular bite-sized updates on Twitter.
More posts...Disclaimer: Content on this site is for educational purpose only and is not financial advice. Nothing on this site should be construed as an offer or recommendation to buy/sell any financial product or service. Please consult a registered investment advisor before making any investments.
This post titled Can you predict stock market returns based on past returns? first appeared on 09 Nov 2022 at https://arthgyaan.com