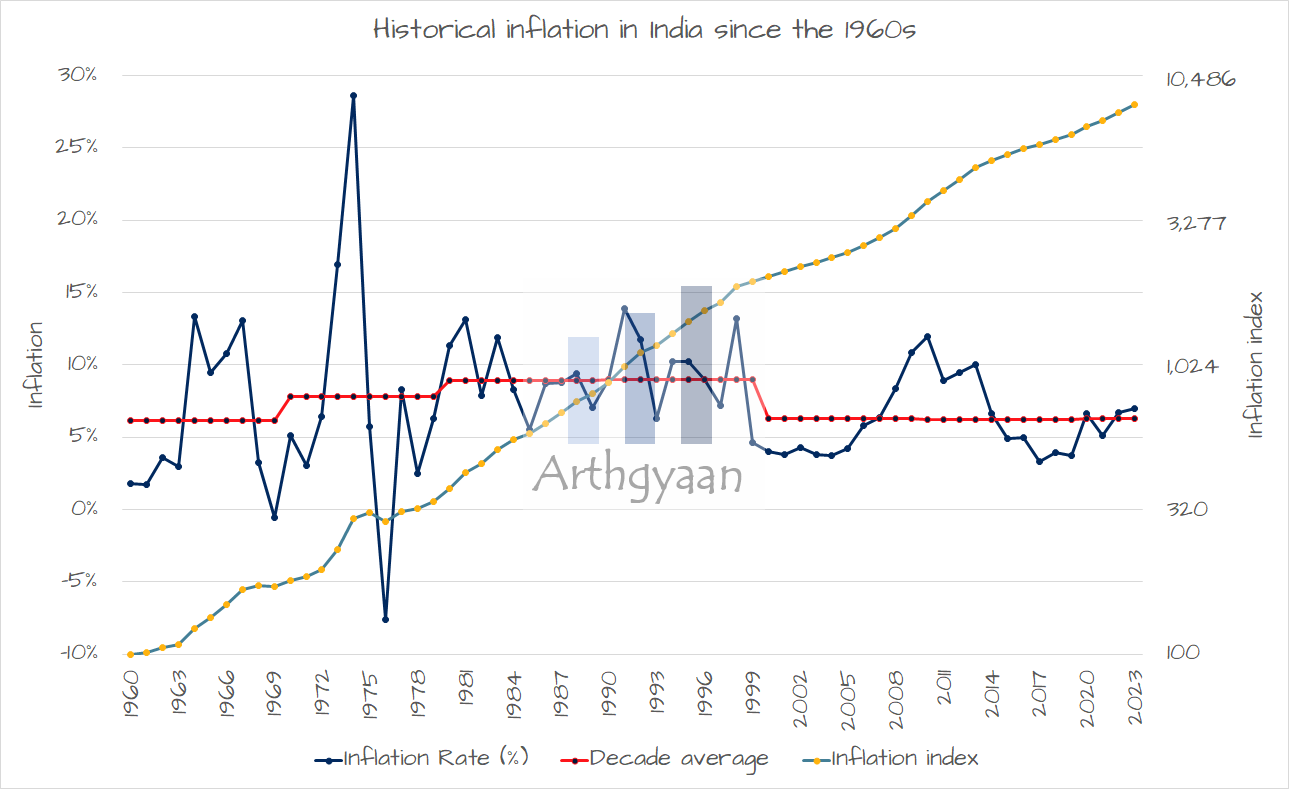
A complete history of inflation in India since the 1960s
This article provides a reference list of inflation in India every year since 1960.
 News
News
This article provides a reference list of inflation in India every year since 1960.

Disclaimer: We have assumed 2023 inflation to be 7.00% as per interim RBI data. The final figure will be known in early 2024. Inflation data is from worlddata.info website.
Inflation is one of the axioms of personal finance and enjoys the same permanence as death and taxes.
Investors who are looking for safety in debt as an asset class would have a perpetual worry as to whether debt products beat inflation or not. Given the downtrend in interest rates in the last decade, anyone dependent on debt as an asset class, pensioners, and general investors allocating a part of their portfolio to debt products have a cause for concern. On the other hand, investors with an equity-heavy portfolio should have fared better vs inflation over time.
Chart: Arthgyaan • Source: RBI • Get the data
Falling interest rates have led to two effects on portfolio valuation and income. First, long-duration bonds have risen in price over this period while interest income from fixed deposits, small saving schemes (like provident fund, NSC) and annuities have gradually come down. Similarly, falling rates positively impact equity valuation since the cost of capital reduces.
In this decade, we are currently in a period of record-low inflation.
| Decade | Average inflation |
|---|---|
| 1960s | 6.17% |
| 1970s | 7.79% |
| 1980s | 8.95% |
| 1990s | 9.00% |
| 2000s | 6.29% |
| 2010s | 6.23% |
| 2020s | 5.91% |
Choosing the right assets to invest so that you can beat inflation is possible and is discussed here: Inflation: the impact on your goals and how to choose assets that beat it
| Year | Inflation |
|---|---|
| 2021 | 5.13% |
| 2022 | 6.70% |
| 2023 | 7.00% |
Note: We have assumed 2023 inflation to be 7.00% as per interim RBI data. The final figure will be known in early 2024.
| Year | Inflation |
|---|---|
| 2011 | 8.91% |
| 2012 | 9.48% |
| 2013 | 10.02% |
| 2014 | 6.67% |
| 2015 | 4.91% |
| 2016 | 4.95% |
| 2017 | 3.33% |
| 2018 | 3.94% |
| 2019 | 3.73% |
| 2020 | 6.62% |
| Year | Inflation |
|---|---|
| 2001 | 3.78% |
| 2002 | 4.30% |
| 2003 | 3.81% |
| 2004 | 3.77% |
| 2005 | 4.25% |
| 2006 | 5.80% |
| 2007 | 6.37% |
| 2008 | 8.35% |
| 2009 | 10.88% |
| 2010 | 11.99% |
| Year | Inflation |
|---|---|
| 1991 | 13.87% |
| 1992 | 11.79% |
| 1993 | 6.33% |
| 1994 | 10.25% |
| 1995 | 10.22% |
| 1996 | 8.98% |
| 1997 | 7.16% |
| 1998 | 13.23% |
| 1999 | 4.67% |
| 2000 | 4.01% |
| Year | Inflation |
|---|---|
| 1981 | 13.11% |
| 1982 | 7.89% |
| 1983 | 11.87% |
| 1984 | 8.32% |
| 1985 | 5.56% |
| 1986 | 8.73% |
| 1987 | 8.80% |
| 1988 | 9.38% |
| 1989 | 7.07% |
| 1990 | 8.97% |
| Year | Inflation |
|---|---|
| 1971 | 3.08% |
| 1972 | 6.44% |
| 1973 | 16.94% |
| 1974 | 28.60% |
| 1975 | 5.75% |
| 1976 | -7.63% |
| 1977 | 8.31% |
| 1978 | 2.52% |
| 1979 | 6.28% |
| 1980 | 11.35% |
| Year | Inflation |
|---|---|
| 1961 | 1.68% |
| 1961 | 1.70% |
| 1962 | 3.63% |
| 1963 | 2.95% |
| 1964 | 13.36% |
| 1965 | 9.47% |
| 1966 | 10.80% |
| 1967 | 13.06% |
| 1968 | 3.24% |
| 1969 | -0.58% |
| 1970 | 5.09% |
The average inflation in India in the 1960s was 6.17%.
The average inflation in India in the 1970s was 7.79%.
The average inflation in India in the 1980s was 8.95%.
The average inflation in India in the 1990s was 9.00%.
The average inflation in India in the 2000s was 6.29%.
The average inflation in India in the 2010s was 6.23%.
The average inflation in India in the 2020s is 6.27%.
The inflation in India in 1960 was 1.78%.
The inflation in India in 1961 was 1.70%.
The inflation in India in 1962 was 3.63%.
The inflation in India in 1963 was 2.95%.
The inflation in India in 1964 was 13.36%.
The inflation in India in 1965 was 9.47%.
The inflation in India in 1966 was 10.80%.
The inflation in India in 1967 was 13.06%.
The inflation in India in 1968 was 3.24%.
The inflation in India in 1969 was -0.58%.
The inflation in India in 1970 was 5.09%.
The inflation in India in 1971 was 3.08%.
The inflation in India in 1972 was 6.44%.
The inflation in India in 1973 was 16.94%.
The inflation in India in 1974 was 28.60%.
The inflation in India in 1975 was 5.75%.
The inflation in India in 1976 was -7.63%.
The inflation in India in 1977 was 8.31%.
The inflation in India in 1978 was 2.52%.
The inflation in India in 1979 was 6.28%.
The inflation in India in 1980 was 11.35%.
The inflation in India in 1981 was 13.11%.
The inflation in India in 1982 was 7.89%.
The inflation in India in 1983 was 11.87%.
The inflation in India in 1984 was 8.32%.
The inflation in India in 1985 was 5.56%.
The inflation in India in 1986 was 8.73%.
The inflation in India in 1987 was 8.80%.
The inflation in India in 1988 was 9.38%.
The inflation in India in 1989 was 7.07%.
The inflation in India in 1990 was 8.97%.
The inflation in India in 1991 was 13.87%.
The inflation in India in 1992 was 11.79%.
The inflation in India in 1993 was 6.33%.
The inflation in India in 1994 was 10.25%.
The inflation in India in 1995 was 10.22%.
The inflation in India in 1996 was 8.98%.
The inflation in India in 1997 was 7.16%.
The inflation in India in 1998 was 13.23%.
The inflation in India in 1999 was 4.67%.
The inflation in India in 2000 was 4.01%.
The inflation in India in 2001 was 3.78%.
The inflation in India in 2002 was 4.30%.
The inflation in India in 2003 was 3.81%.
The inflation in India in 2004 was 3.77%.
The inflation in India in 2005 was 4.25%.
The inflation in India in 2006 was 5.80%.
The inflation in India in 2007 was 6.37%.
The inflation in India in 2008 was 8.35%.
The inflation in India in 2009 was 10.88%.
The inflation in India in 2010 was 11.99%.
The inflation in India in 2011 was 8.91%.
The inflation in India in 2012 was 9.48%.
The inflation in India in 2013 was 10.02%.
The inflation in India in 2014 was 6.67%.
The inflation in India in 2015 was 4.91%.
The inflation in India in 2016 was 4.95%.
The inflation in India in 2017 was 3.33%.
The inflation in India in 2018 was 3.94%.
The inflation in India in 2019 was 3.73%.
The inflation in India in 2020 was 6.62%.
The inflation in India in 2021 was 5.13%.
The inflation in India in 2022 was 6.70%.
The inflation in India in 2023 was 7.00%.
Published: 18 December 2025
8 MIN READ
1. Email me with any questions.
2. Use our goal-based investing template to prepare a financial plan for yourself.Don't forget to share this article on WhatsApp or Twitter or post this to Facebook.
Discuss this post with us via Facebook or get regular bite-sized updates on Twitter.
More posts...Disclaimer: Content on this site is for educational purpose only and is not financial advice. Nothing on this site should be construed as an offer or recommendation to buy/sell any financial product or service. Please consult a registered investment advisor before making any investments.
This post titled A complete history of inflation in India since the 1960s first appeared on 12 Dec 2023 at https://arthgyaan.com