A complete history of gold prices in India since the 1950s
This article provides a reference list of gold prices in India every year since 1950.
This article provides a reference list of gold prices in India every year since 1950.

Disclaimer: The historical gold prices in this article are collated from multiple sources over the Internet. The prices since 2007 are yearly averages.
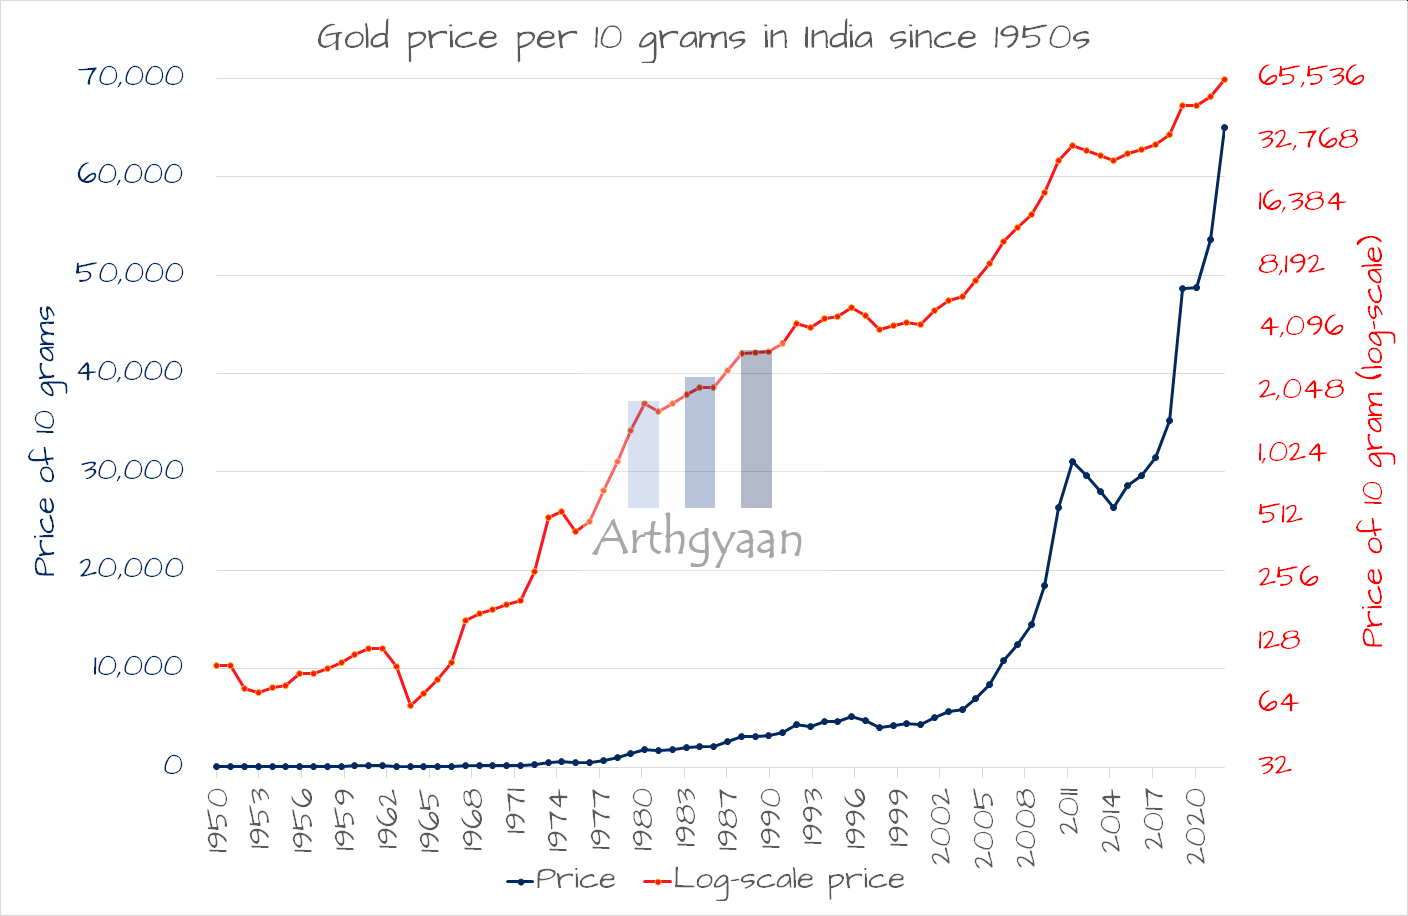
Gold has risen 729 times in 74 years with a CAGR of 9.32%
We show the gold price (per 10 grams) in two ways. The blue line is the price using a normal scale on the chart. But the actual price movement is seen in the red line which shows the time it took for the price to double. This CAGR shows that gold, on an average, has doubled in price every 8 years as per rule of 72.
Never cross a river that is on average 4 feet deep - Nicholas Taleb.
A very common misconception about gold is that gold always goes up in value. The table below shows the returns for various time periods for gold which shows that gold does not always go up in value. Planning to buy gold, based on average returns, might give nasty surprises as per the quote above.
| Invested for | Min | Average | Max |
|---|---|---|---|
| Any 1-year period | -35.05% | 10.51% | 82.01% |
| Any 2-year period | -27.24% | 10.11% | 58.27% |
| Any 3-year period | -19.10% | 10.03% | 39.87% |
| Any 5-year period | -9.19% | 10.00% | 33.03% |
| Any 8-year period | -4.36% | 10.03% | 26.56% |
| Any 10-year period | -1.99% | 10.13% | 25.02% |
| Any 15-year period | -2.10% | 10.54% | 22.67% |
An interesting point to note is that the average return is extremely stable although the maximum and minimum values have fluctuated a lot.
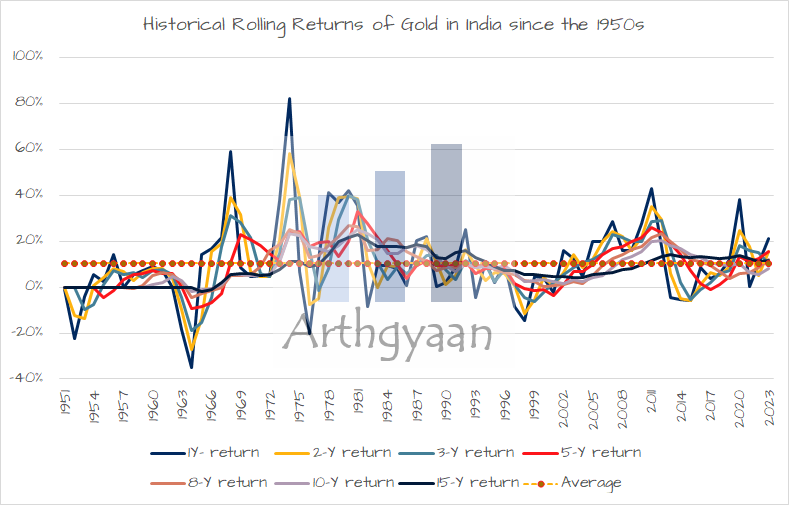
But as the Taleb quote above shows, you might be surprised once you see the actual returns and the fluctuations around the 10% average.
This calculator helps you determine the total cost of gold jewellery, including making charges and GST.
Enter Today’s Gold Price
Input the current price of gold per gram in ₹.
Enter Grams of Gold
Input the weight of the jewellery in grams.
Enter Making Charge (%)
Input the percentage charged for making the jewellery.
Enter GST (%)
Input the applicable GST percentage.
Note: If you already own the gold as a bar or biscuit, GST is applied only the making charge.
The calculator will automatically display:
All calculations update in real-time as you change the inputs.
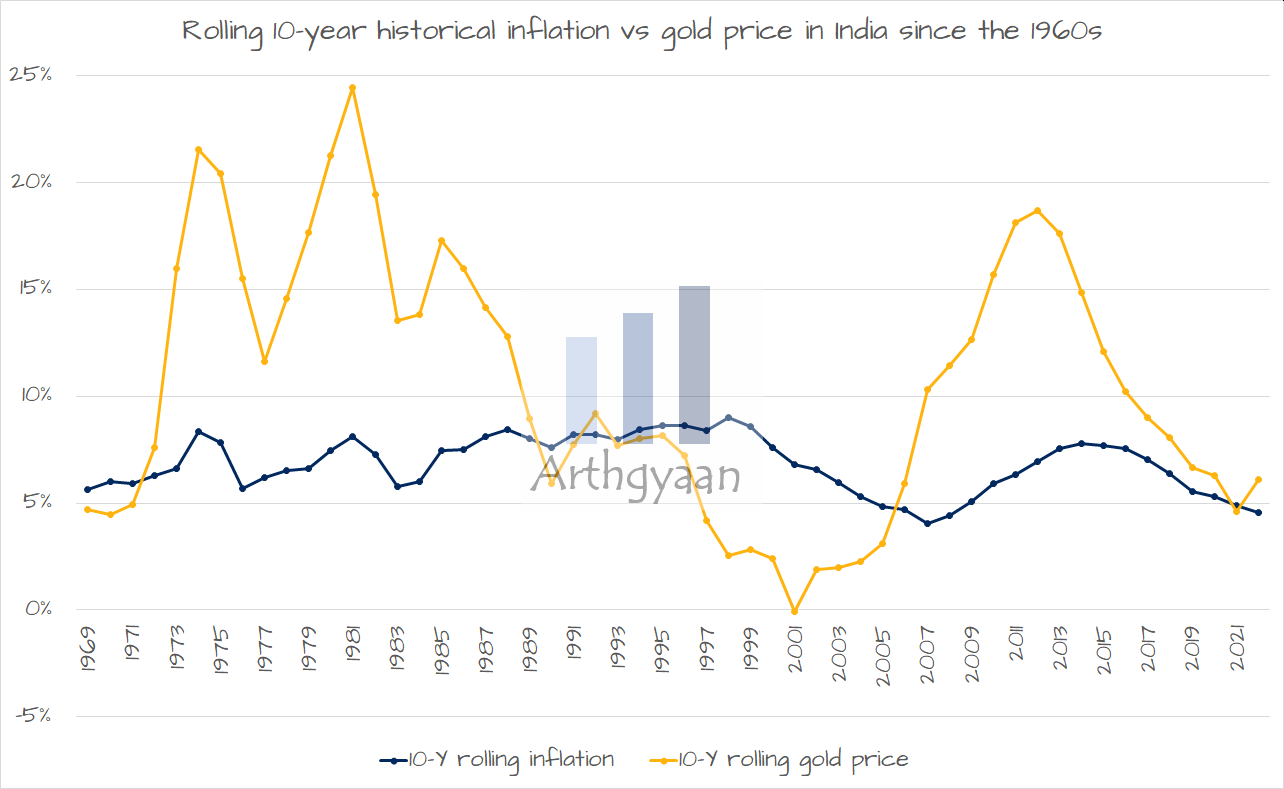
Note: The data in this section has inflation and gold price data from 1960 onwards. Inflation data is from the worlddata.info website
| Statistic | 10-Y rolling inflation | 10-Y rolling gold price |
|---|---|---|
| Min | 4.06% | -0.08% |
| Average | 6.82% | 10.45% |
| Max | 9.01% | 24.45% |
As the data shows quite clearly above, gold has mostly beat inflation.
We now show how the price has changed every year since 1950.
All the tables below show the price of ₹10 grams of gold.
| Decade | Minimum price | Maximum price | Average | Start | 10-Y Change % |
|---|---|---|---|---|---|
| 1950s | 73 | 102 | 88 | 99 | NA |
| 1960s | 63 | 176 | 111 | 111 | 12% |
| 1970s | 184 | 937 | 444 | 184 | 66% |
| 1980s | 1,330 | 3,140 | 2,166 | 1,330 | 623% |
| 1990s | 3,200 | 5,160 | 4,258 | 3,200 | 141% |
| 2000s | 4,300 | 15,417 | 7,775 | 4,400 | 38% |
| 2010s | 18,448 | 35,154 | 28,088 | 18,448 | 319% |
| 2020s | 47,437 | 100,000+ | 62,345 | 47,562 | 158% |
| Year | Gold price |
|---|---|
| 2021 | ₹47,437 |
| 2022 | ₹51,249 |
| 2023 | ₹58,836 |
| 2024 | ₹77,000 |
| 2025 | ₹131777 (latest) |
| Year | Gold price |
|---|---|
| 2011 | ₹24,130 |
| 2012 | ₹29,926 |
| 2013 | ₹28,848 |
| 2014 | ₹27,708 |
| 2015 | ₹26,671 |
| 2016 | ₹30,128 |
| 2017 | ₹29,174 |
| 2018 | ₹30,692 |
| 2019 | ₹35,154 |
| 2020 | ₹47,562 |
| Year | Gold price |
|---|---|
| 2001 | ₹4,300 |
| 2002 | ₹4,990 |
| 2003 | ₹5,600 |
| 2004 | ₹5,850 |
| 2005 | ₹7,000 |
| 2006 | ₹8,400 |
| 2007 | ₹9,428 |
| 2008 | ₹12,361 |
| 2009 | ₹15,417 |
| 2010 | ₹18,448 |
| Year | Gold price |
|---|---|
| 1991 | ₹3,466 |
| 1992 | ₹4,334 |
| 1993 | ₹4,140 |
| 1994 | ₹4,598 |
| 1995 | ₹4,680 |
| 1996 | ₹5,160 |
| 1997 | ₹4,725 |
| 1998 | ₹4,045 |
| 1999 | ₹4,234 |
| 2000 | ₹4,400 |
| Year | Gold price |
|---|---|
| 1981 | ₹1,800 |
| 1982 | ₹1,645 |
| 1983 | ₹1,800 |
| 1984 | ₹1,970 |
| 1985 | ₹2,130 |
| 1986 | ₹2,140 |
| 1987 | ₹2,570 |
| 1988 | ₹3,130 |
| 1989 | ₹3,140 |
| 1990 | ₹3,200 |
| Year | Gold price |
|---|---|
| 1971 | ₹193 |
| 1972 | ₹202 |
| 1973 | ₹278 |
| 1974 | ₹506 |
| 1975 | ₹540 |
| 1976 | ₹432 |
| 1977 | ₹486 |
| 1978 | ₹685 |
| 1979 | ₹937 |
| 1980 | ₹1,330 |
| Year | Gold price |
|---|---|
| 1961 | ₹119 |
| 1962 | ₹119 |
| 1963 | ₹97 |
| 1964 | ₹63 |
| 1965 | ₹72 |
| 1966 | ₹84 |
| 1967 | ₹102 |
| 1968 | ₹162 |
| 1969 | ₹176 |
| 1970 | ₹184 |
| Year | Gold price |
|---|---|
| 1950 | ₹99 |
| 1951 | ₹98 |
| 1952 | ₹76 |
| 1953 | ₹73 |
| 1954 | ₹77 |
| 1955 | ₹79 |
| 1956 | ₹90 |
| 1957 | ₹90 |
| 1958 | ₹95 |
| 1959 | ₹102 |
| 1960 | ₹111 |
The price of 10 grams of gold in 1950s in India was between ₹73 and ₹102.
The price of 10 grams of gold in 1960s in India was between ₹63 and ₹176.
The price of 10 grams of gold in 1970s in India was between ₹184 and ₹937.
The price of 10 grams of gold in 1980s in India was between ₹1,330 and ₹3,140.
The price of 10 grams of gold in 1990s in India was between ₹3,200 and ₹5,160.
The price of 10 grams of gold in 2000s in India was between ₹4,300 and ₹15,417.
The price of 10 grams of gold in 2010s in India was between ₹18,448 and ₹35,154.
The price of 10 grams of gold in 2020s in India was between ₹47,437 and ₹58,836.
The price of 10 grams of gold in 1950 in India was ₹99.
The price of 10 grams of gold in 1951 in India was ₹98.
The price of 10 grams of gold in 1952 in India was ₹76.
The price of 10 grams of gold in 1953 in India was ₹73.
The price of 10 grams of gold in 1954 in India was ₹77.
The price of 10 grams of gold in 1955 in India was ₹79.
The price of 10 grams of gold in 1956 in India was ₹90.
The price of 10 grams of gold in 1957 in India was ₹90.
The price of 10 grams of gold in 1958 in India was ₹95.
The price of 10 grams of gold in 1959 in India was ₹102.
The price of 10 grams of gold in 1960 in India was ₹111.
The price of 10 grams of gold in 1961 in India was ₹119.
The price of 10 grams of gold in 1962 in India was ₹119.
The price of 10 grams of gold in 1963 in India was ₹97.
The price of 10 grams of gold in 1964 in India was ₹63.
The price of 10 grams of gold in 1965 in India was ₹72.
The price of 10 grams of gold in 1966 in India was ₹84.
The price of 10 grams of gold in 1967 in India was ₹102.
The price of 10 grams of gold in 1968 in India was ₹162.
The price of 10 grams of gold in 1969 in India was ₹176.
The price of 10 grams of gold in 1970 in India was ₹184.
The price of 10 grams of gold in 1971 in India was ₹193.
The price of 10 grams of gold in 1972 in India was ₹202.
The price of 10 grams of gold in 1973 in India was ₹278.
The price of 10 grams of gold in 1974 in India was ₹506.
The price of 10 grams of gold in 1975 in India was ₹540.
The price of 10 grams of gold in 1976 in India was ₹432.
The price of 10 grams of gold in 1977 in India was ₹486.
The price of 10 grams of gold in 1978 in India was ₹685.
The price of 10 grams of gold in 1979 in India was ₹937.
The price of 10 grams of gold in 1980 in India was ₹1,330.
The price of 10 grams of gold in 1981 in India was ₹1,800.
The price of 10 grams of gold in 1982 in India was ₹1,645.
The price of 10 grams of gold in 1983 in India was ₹1,800.
The price of 10 grams of gold in 1984 in India was ₹1,970.
The price of 10 grams of gold in 1985 in India was ₹2,130.
The price of 10 grams of gold in 1986 in India was ₹2,140.
The price of 10 grams of gold in 1987 in India was ₹2,570.
The price of 10 grams of gold in 1988 in India was ₹3,130.
The price of 10 grams of gold in 1989 in India was ₹3,140.
The price of 10 grams of gold in 1990 in India was ₹3,200.
The price of 10 grams of gold in 1991 in India was ₹3,466.
The price of 10 grams of gold in 1992 in India was ₹4,334.
The price of 10 grams of gold in 1993 in India was ₹4,140.
The price of 10 grams of gold in 1994 in India was ₹4,598.
The price of 10 grams of gold in 1995 in India was ₹4,680.
The price of 10 grams of gold in 1996 in India was ₹5,160.
The price of 10 grams of gold in 1997 in India was ₹4,725.
The price of 10 grams of gold in 1998 in India was ₹4,045.
The price of 10 grams of gold in 1999 in India was ₹4,234.
The price of 10 grams of gold in 2000 in India was ₹4,400.
The price of 10 grams of gold in 2001 in India was ₹4,300.
The price of 10 grams of gold in 2002 in India was ₹4,990.
The price of 10 grams of gold in 2003 in India was ₹5,600.
The price of 10 grams of gold in 2004 in India was ₹5,850.
The price of 10 grams of gold in 2005 in India was ₹7,000.
The price of 10 grams of gold in 2006 in India was ₹8,400.
The price of 10 grams of gold in 2007 in India was ₹9,428.
The price of 10 grams of gold in 2008 in India was ₹12,361.
The price of 10 grams of gold in 2009 in India was ₹15,417.
The price of 10 grams of gold in 2010 in India was ₹18,448.
The price of 10 grams of gold in 2011 in India was ₹24,130.
The price of 10 grams of gold in 2012 in India was ₹29,926.
The price of 10 grams of gold in 2013 in India was ₹28,848.
The price of 10 grams of gold in 2014 in India was ₹27,708.
The price of 10 grams of gold in 2015 in India was ₹26,671.
The price of 10 grams of gold in 2016 in India was ₹30,128.
The price of 10 grams of gold in 2017 in India was ₹29,174.
The price of 10 grams of gold in 2018 in India was ₹30,692.
The price of 10 grams of gold in 2019 in India was ₹35,154.
The price of 10 grams of gold in 2020 in India was ₹47,562.
The price of 10 grams of gold in 2021 in India was ₹47,437.
The price of 10 grams of gold in 2022 in India was ₹51,249.
The price of 10 grams of gold in 2023 in India was ₹58,836.
The price of 10 grams of gold in 2024 in India was ₹75,373.
The price of 10 grams of gold in 2025 in India is around ₹80,000.
Published: 18 December 2025
7 MIN READ
1. Email me with any questions.
2. Use our goal-based investing template to prepare a financial plan for yourself.Don't forget to share this article on WhatsApp or Twitter or post this to Facebook.
Discuss this post with us via Facebook or get regular bite-sized updates on Twitter.
More posts...Disclaimer: Content on this site is for educational purpose only and is not financial advice. Nothing on this site should be construed as an offer or recommendation to buy/sell any financial product or service. Please consult a registered investment advisor before making any investments.
This post titled A complete history of gold prices in India since the 1950s first appeared on 13 Dec 2023 at https://arthgyaan.com