How to use the SEBI Potential Risk Class matrix to understand risk in debt mutual funds?
This article shows you the way to understand the risk and return potential for debt mutual funds using a SEBI-mandated risk classification tool.
This article shows you the way to understand the risk and return potential for debt mutual funds using a SEBI-mandated risk classification tool.

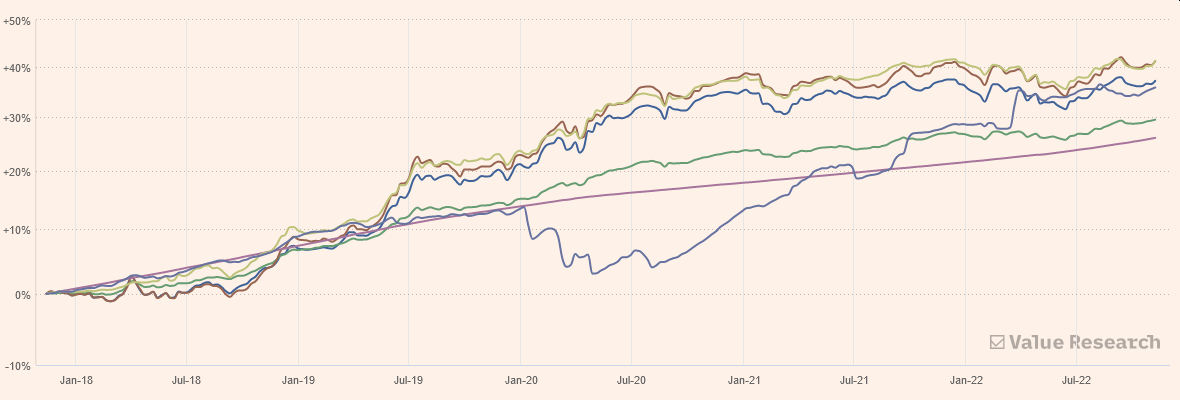
Debt mutual funds behave differently from what investors expect them to. Instead of steady growth and income generation over time, debt funds can fluctuate considerably as the chart below shows for some selected debt fund categories:
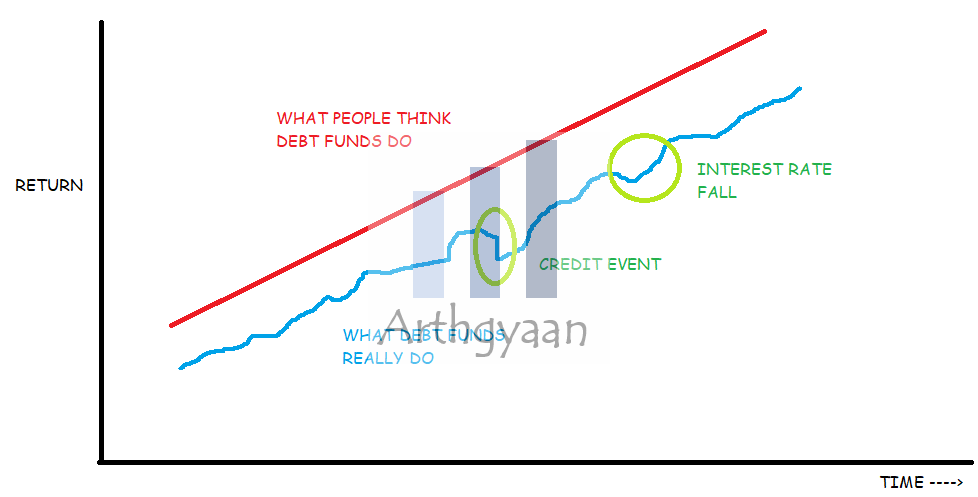
To guide investors regarding the type of risk embedded in debt mutual funds, SEBI has come up with the Potential Risk Class matrix that is a part of the mandatory portfolio disclosures of debt mutual funds. Before understanding the matrix, we will look at how risk manifests in a debt mutual fund.
Like all mutual funds, and unlike Fixed Deposit (FD), debt fund returns (and the principal invested) are not guaranteed and returns can fluctuate continuously.
In a debt mutual fund, risk (and return) comes from two main sources:
This determines how good the underlying bond is in terms of the issuer’s capability of paying back the regular interest (called a coupon) and the money borrowed (the principal) of the bond.
Issuers are rated by Credit Rating agencies (like S&P, Moody’s, Fitch, CRISIL, Indiaratings, etc.) and given a scale like AAA (best quality), AA (lower than best), to D (worst quality - unable to pay back the money borrowed). The higher the credit rating (AAA or SOV - for the government), the lower the coupon and the lower the credit risk.
For our framework for selecting debt mutual funds, we stick to a mix of SOV/AAA/A1+/Cash only (same as SEBI’s new Class A, i.e., CRV >= 12 categorization).
This affects the prices of bonds already in the market.
If an existing bond offering a 7% coupon is pitted against a new bond that offers a lower coupon of 6% (interest rates are falling), then the existing bond is more desirable and so is a debt fund holding these older 7% bonds. The reverse happens if interest rates rise in the economy - debt fund NAVs fall. This metric, for measuring interest rate risk, is called Modified Duration, and is available for all debt funds. It measures the rate of change of the portfolio NAV due to changes in interest rates.
For our framework for selecting debt mutual funds, we will stick to a duration of up to 1, which effectively means that for every 1% rise (fall) in interest rates, the fund NAV will fall (rise) by 1%. The debt fund categories that satisfy this criterion are overnight, liquid, ultra-short, low duration, and money market funds. This is the full list from SEBI. The new June 2021 debt fund classification by SEBI defines Macaulay Duration of less than or equal to 1 year as Class 1. This recommendation is in line with the SEBI definition since Duration < Macaulay Duration for all debt funds.
In general, funds with large AuM increase diversification. There is no role of star ratings or past performance in choosing a debt fund.
Debt fund investors should be wary that, unlike western countries, there is no bond market in India for corporate bonds. There is a market for government bonds, but mostly banks and other institutions participate in that market with deals happening in crores.
Credit and interest risk manifest as liquidity risk. Liquidity risk means that the bond cannot be sold without incurring a substantial loss since there would not be any buyers. The lack of buyers could be due to:
We will now apply these definitions of risk in understanding the SEBI matrix.

SEBI, as per circular SEBI/HO/IMD/IMD-II DOF3/P/CIR/2021/573 issued on June 07, 2021, amended the regulations for the classification of debt funds to better allow investors to understand the risks when choosing one. These new classifications are effective since December 2021. As per the new SEBI criteria, risk in debt funds is classified as Credit risk and Interest Rate risk. These risks are combined into a matrix called the Potential Risk Class (PRC) matrix.
One of the triggers for introducing the Potential Risk Class was the Franklin Templeton incident when six debt funds run by Franklin Templeton were frozen in April 2020 citing liquidity issues.
As per SEBI, the matrix should be available on the front page of the new fund offering (NFO) application form, Scheme Information Documents (SID) and Key Information Memorandum (KIM) as well as the common application form of the AMC.

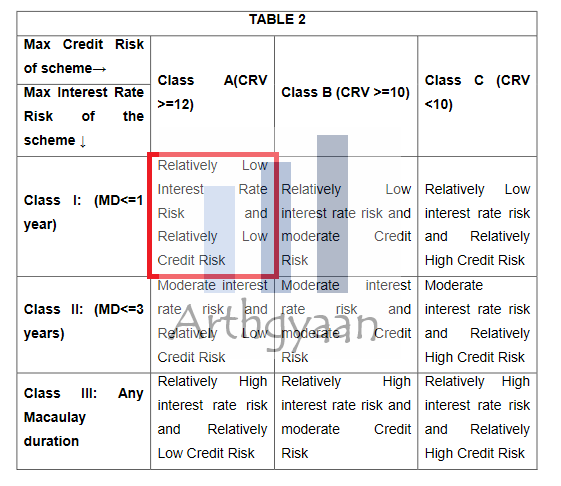
SEBI classifies the credit risk of the bonds in the debt fund portfolio based on the credit rating using a 13-point scale called Credit Risk Value (CRV). The CRV number is then used to create three bands: A,B,C. To understand credit ratings better, please refer to this article: Frequently asked questions on Credit Rating: the complete guide
SEBI classifies interest rate risk using the concept of the Macaulay Duration. This number is an indication of the number of years the investor needs to be invested in a bond to ensure that they have got back their investment. To understand duration better, please refer to this article: Should you match debt portfolio duration with goal duration?

SEBI defines 3 thresholds each for credit and interest risk for defining the matrix using the maximum weighted average values. For credit risk there are classes A (safest) to C (least safe). For interest rate risk, the classes are I (least fluctuation with interest rates) to III (highest fluctuation with interest rates). Investors should note that the matrix is a qualitative tool and good for comparing one debt fund with another. It does not provide an absolute numeric definition of the risks in the fund.
Debt funds invest as per the investment mandate available in fund documents like the Scheme Information Document (SID). They are also governed by the SEBI classification on debt funds which has led to 18 categories of debt mutual funds. Unfortunately, many debt fund categories are loosely defined, like say Low Duration, which has the potential of drift in the risk dimension that is not tightly specified by SEBI. The onus is on the investor to continuously monitor the portfolio disclosure statement of their debt funds to ensure that the fund invests as per their requirement and understanding of risk.
The Potential Risk Class matrix is a tool for comparing debt funds amongst themselves based on risk. There is no guarantee that investors in A-I rated funds will always get their money back. It is just that, relatively speaking, an A-I rated fund has lesser risk than B-II which in turn has lower risk than C-III.
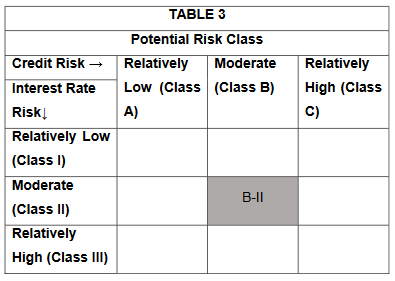
The above image, from the SEBI site, shows a sample matrix with value B-II. In this, the CRV grade is Class B (AA or better-rated bonds) with the Macaulay duration of the portfolio being 3 years or less. This portfolio, therefore, has a fair bit of risk, though unquantified, and investors understand if they are comfortable vs. say an A-I rated fund or consider one with more risk in the hope of getting a higher return.
The Franklin incident had several reasons that lead to the closure and the final result was precipitated by the COVID-19 pandemic’s effect on the domestic bond market. One of the reasons that the funds were impacted was having longer maturity bonds in a portfolio that should be short maturity on average. If there is a liquidity event, the longer-maturity bond will give back money a lot later than the rest of the portfolio. Given the way the Potential Risk Class matrix is defined, the maximum residual maturity of each bond in the portfolio is capped:
However, there is no such cap in case the bonds are issued by Central/State governments in cases of Class I and II categories.
We prefer that investors avoid unnecessary risk in the debt asset allocation. We have covered this as a framework reproduced below:
We have covered the framework in detail in this article: How to choose a debt mutual fund?
SEBI, as per circular SEBI/HO/IMD/IMD-II DOF3/P/CIR/2021/573 issued on June 07, 2021, amended the [regulations](https://www.sebi.gov.in/legal/circulars/jun-2021/circular-on-potential-risk-class-matrix-for-debt-schemes-based-on-interest-rate-risk-and-credit-risk_50440.html) for the classification of debt funds to better allow investors to understand the risks when choosing one. These new classifications are effective since December 2021. As per the new SEBI criteria, risk in debt funds is classified as Credit risk and Interest Rate risk. These risks are combined into a matrix called the Potential Risk Class (PRC) matrix.
One of the triggers for introducing the Potential Risk Class was the Franklin Templeton incident when six debt funds run by Franklin Templeton were frozen in April 2020 citing liquidity issues.
As per SEBI, the matrix should be available on the front page of the new fund offering (NFO) application form, Scheme Information Documents (SID) and Key Information Memorandum (KIM) as well as the common application form of the AMC.
SEBI classifies the credit risk of the bonds in the debt fund portfolio based on the credit rating using a 13-point scale called Credit Risk Value (CRV). The CRV number is then used to create three bands: A,B,C. To understand credit ratings better, please refer to this article: [Frequently asked questions on Credit Rating: the complete guide](/blog/faq-credit-rating.html)
SEBI classifies interest rate risk using the concept of the Macaulay Duration. This number is an indication of the number of years the investor needs to be invested in a bond to ensure that they have got back their investment. To understand duration better, please refer to this article: [Should you match debt portfolio duration with goal duration?](/blog/match-goal-duration-with-debt-portfolio-duration.html)
SEBI defines 3 thresholds each for credit and interest risk for defining the matrix using the maximum weighted average values. For credit risk there are classes A (safest) to C (least safe). For interest rate risk, the classes are I (least fluctuation with interest rates) to III (highest fluctuation with interest rates). Investors should note that the matrix is a qualitative tool and good for comparing one debt fund with another. It does not provide an absolute numeric definition of the risks in the fund.
Debt funds invest as per the investment mandate available in fund documents like the Scheme Information Document (SID). They are also governed by the SEBI classification on debt funds which has led to 18 categories of debt mutual funds. Unfortunately, many debt fund categories are loosely defined, like say Low Duration, which has the potential of drift in the risk dimension that is not tightly specified by SEBI. The onus is on the investor to continuously monitor the portfolio disclosure statement of their debt funds to ensure that the fund invests as per their requirement and understanding of risk.
The Potential Risk Class matrix is a tool for comparing debt funds amongst themselves based on risk. There is no guarantee that investors in A-I rated funds will always get their money back. It is just that, relatively speaking, an A-I rated fund has lesser risk than B-II which in turn has lower risk than C-III.


1. Email me with any questions.
2. Use our goal-based investing template to prepare a financial plan for yourself.Don't forget to share this article on WhatsApp or Twitter or post this to Facebook.
Discuss this post with us via Facebook or get regular bite-sized updates on Twitter.
More posts...Disclaimer: Content on this site is for educational purpose only and is not financial advice. Nothing on this site should be construed as an offer or recommendation to buy/sell any financial product or service. Please consult a registered investment advisor before making any investments.
This post titled How to use the SEBI Potential Risk Class matrix to understand risk in debt mutual funds? first appeared on 16 Nov 2022 at https://arthgyaan.com