Top Mutual Funds with High Returns & Low Risk for Bottom Fishing
This article highlights the best-performing equity and hybrid funds, based on their historical performance compared to the Nifty 50 index.

Disclaimer: The Fund names in this article are not recommendations to buy/hold/sell. Mutual funds are subject to market risks. Do not invest real money without adequate research.
High returns at low risk is the ultimate investment goal for mutual fund investors. The stock market always has opportunities to pick up funds that have the potential to give stable returns with lower fluctuations.
Identifying funds that have done well in the past vs. the Nifty 50 index fund can be tricky since getting and analysing the data might be tricky.
This article shows a list of mutual funds based on their historical returns.
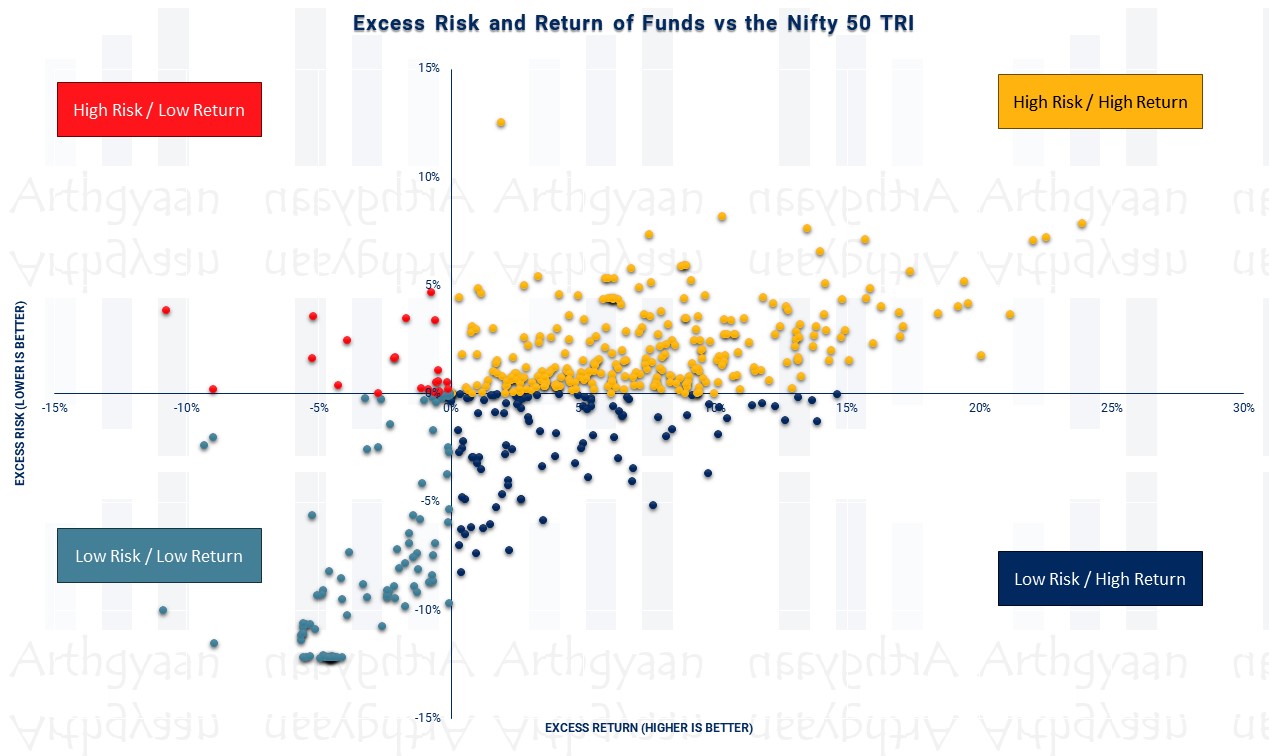
If we split the list of all equity mutual funds then we will end up with four categories:
Related:
Which are high-risk and underperforming mutual funds that can be avoided by investors?
Users of the free Arthgyaan mutual fund portfolio review service will get the above chart created for all funds in their portfolio.
In this article, we will look at the latest list of equity mutual funds, including index funds tracking indices other than the Nifty 50, to check if they are in the best category of higher returns and lower risk.
In the analysis below, we have chosen equity and hybrid mutual funds with higher returns at lower risk using the last three years of market data from AMFI for the period ending 24-Jan-2025. The funds that have fallen the most from their 52-week high levels are presented first.
Related:
Bottom fishing tracker: which mutual funds have fallen the most?
Note: This chart represents point-to-point data. The funds in the list will change over time as the future performance of any particular fund is random and cannot be predicted in advance.
Fund | Fall | 52w high NAV | NAV (24-Jan-2025) |
---|---|---|---|
BANK OF INDIA BALANCED ADVANTAGE | -9.70% | 27.6528 | 24.9701 |
NJ Balanced Advantage | -8.99% | 15.1300 | 13.7700 |
Baroda BNP Paribas Balanced Advantage | -6.18% | 26.1182 | 24.5034 |
HDFC Balanced Advantage | -6.05% | 556.2500 | 522.6210 |
Mahindra Manulife Balanced Advantage | -5.94% | 15.2721 | 14.3657 |
Aditya Birla Sun Life Balanced Advantage | -5.59% | 117.8500 | 111.2600 |
Invesco India Balanced Advantage | -5.49% | 63.9200 | 60.4100 |
Axis Balanced Advantage | -4.97% | 23.1300 | 21.9800 |
ICICI Prudential Balanced Advantage | -4.66% | 79.7800 | 76.0600 |
SBI Balanced Advantage | -3.38% | 15.5172 | 14.9929 |
Fund | Fall | 52w high NAV | NAV (24-Jan-2025) |
---|---|---|---|
JM Aggressive Hybrid | -11.00% | 146.6406 | 130.5103 |
Groww Aggressive Hybrid | -9.32% | 23.8886 | 21.6630 |
Mirae Asset Aggressive Hybrid | -9.03% | 37.6590 | 34.2600 |
ICICI Prudential Equity & Debt | -8.91% | 433.2100 | 394.6100 |
Sundaram Aggressive Hybrid | -8.83% | 188.5837 | 171.9404 |
Aditya Birla Sun Life Equity Hybridโ95 | -8.82% | 1731.0200 | 1578.3100 |
BANDHAN Hybrid Equity | -8.81% | 28.9280 | 26.3790 |
CANARA ROBECO EQUITY HYBRID | -8.60% | 410.3300 | 375.0300 |
Tata Hybrid Equity | -8.47% | 506.7607 | 463.8606 |
Mahindra Manulife Aggressive Hybrid | -8.45% | 30.2236 | 27.6695 |
Edelweiss Aggressive Hybrid | -7.98% | 73.2900 | 67.4400 |
UTI Aggressive Hybrid | -7.64% | 443.2494 | 409.3744 |
Kotak Equity Hybrid - Growth - Direct | -7.62% | 73.5960 | 67.9910 |
Navi Aggressive Hybrid | -7.61% | 23.5179 | 21.7276 |
Invesco India Aggressive Hybrid | -7.50% | 25.7083 | 23.7810 |
DSP Aggressive Hybrid | -6.84% | 398.3100 | 371.0500 |
HDFC Hybrid Equity | -6.35% | 127.4990 | 119.4030 |
Franklin India Equity Hybrid | -6.28% | 308.4749 | 289.1077 |
Fund | Fall | 52w high NAV | NAV (24-Jan-2025) |
---|---|---|---|
Canara Robeco Focused Equity | -11.50% | 21.5600 | 19.0800 |
Aditya Birla Sun Life Focused | -11.39% | 165.3609 | 146.5288 |
HDFC Focused 30 | -9.13% | 256.6460 | 233.2080 |
SBI FOCUSED EQUITY | -6.20% | 386.5074 | 362.5283 |
Fund | Fall | 52w high NAV | NAV (24-Jan-2025) |
---|---|---|---|
HDFC Large Cap | -12.35% | 1306.5220 | 1145.1020 |
Aditya Birla Sun Life Frontline Equity | -12.28% | 605.2500 | 530.9300 |
Franklin India Bluechip | -11.71% | 1177.1235 | 1039.2925 |
Kotak Bluechip | -11.58% | 678.8240 | 600.2260 |
ICICI Prudential Bluechip | -11.34% | 124.4200 | 110.3100 |
Sundaram Large Cap | -11.30% | 23.9802 | 21.2715 |
CANARA ROBECO BLUE CHIP EQUITY | -10.67% | 74.4900 | 66.5400 |
SBI BLUE CHIP | -10.63% | 105.5046 | 94.2853 |
DSP Top 100 Equity | -10.30% | 526.4090 | 472.1680 |
Fund | Fall | 52w high NAV | NAV (24-Jan-2025) |
---|---|---|---|
Edelweiss Nifty 100 Quality 30 Index | -13.32% | 16.2351 | 14.0727 |
BANDHAN Nifty 50 Index | -11.65% | 57.4997 | 50.8013 |
Navi Nifty 50 Index | -11.61% | 16.9405 | 14.9742 |
Edelweiss MSCI India Domestic & World Healthcare 45 Index | -5.89% | 20.7929 | 19.5690 |
Fund | Fall | 52w high NAV | NAV (24-Jan-2025) |
---|---|---|---|
CANARA ROBECO FLEXICAP | -12.21% | 391.4900 | 343.6800 |
Union Flexi Cap | -11.22% | 58.3600 | 51.8100 |
Tata Flexi Cap | -10.07% | 27.1186 | 24.3884 |
SBI Flexicap | -9.62% | 127.6240 | 115.3445 |
HDFC Flexi Cap | -9.37% | 2147.7960 | 1946.6430 |
Parag Parikh Flexi Cap | -3.70% | 89.4327 | 86.1202 |
Fund | Fall | 52w high NAV | NAV (24-Jan-2025) |
---|---|---|---|
ICICI Prudential Value Discovery | -10.17% | 524.2800 | 470.9600 |
Quantum Long Term Equity Value | -8.46% | 135.7700 | 124.2900 |
DSP Value | -5.75% | 22.3220 | 21.0390 |
Fund | Fall | 52w high NAV | NAV (24-Jan-2025) |
---|---|---|---|
ICICI Prudential ELSS Tax Saver | -13.41% | 1076.6800 | 932.2500 |
HDFC ELSS Tax saver - Growth Option - Direct Plan | -11.02% | 1537.1960 | 1367.7270 |
Sundaram ELSS Tax Saver | -10.89% | 561.4681 | 500.2992 |
PGIM India ELSS Tax Saver | -8.57% | 40.6100 | 37.1300 |
Quantum ELSS Tax Saver | -8.40% | 135.0400 | 123.6900 |
Parag Parikh ELSS Tax Saver | -6.84% | 33.9407 | 31.6204 |
Fund | Fall | 52w high NAV | NAV (24-Jan-2025) |
---|---|---|---|
UTI Multi Asset Allocation | -6.05% | 82.0457 | 77.0823 |
Tata Multi Asset Opportnities | -5.86% | 24.9829 | 23.5195 |
Tata Multi Asset Opportunities | -5.86% | 24.9829 | 23.5195 |
Nippon India Multi Asset Allocation | -5.44% | 22.0554 | 20.8551 |
ICICI Prudential Multi-Asset | -4.27% | 799.0584 | 764.9652 |
HDFC Multi-Asset | -4.12% | 76.6140 | 73.4600 |
SBI MULTI ASSET ALLOCATION | -3.92% | 62.8037 | 60.3396 |
Fund | Fall | 52w high NAV | NAV (24-Jan-2025) |
---|---|---|---|
SBI Equity Minimum Variance | -14.49% | 27.2354 | 23.2902 |
ICICI Prudential Bharat Consumption | -13.63% | 29.7100 | 25.6600 |
ICICI Prudential FMCG | -13.50% | 603.6400 | 522.1400 |
Tata Ethical | -13.21% | 493.1378 | 427.9971 |
UTI - MNC | -12.28% | 474.0691 | 415.8320 |
ICICI Prudential MNC | -11.72% | 33.0200 | 29.1500 |
ICICI Prudential ESG Exclusionary Strategy | -11.45% | 24.8000 | 21.9600 |
ICICI Prudential Exports & Services | -11.16% | 183.0800 | 162.6500 |
QUANTUM ESG BEST IN CLASS STRATEGY | -11.13% | 27.0400 | 24.0300 |
ICICI Prudential Business Cycle | -11.03% | 25.4700 | 22.6600 |
ICICI Prudential India Opportunities | -10.48% | 39.3100 | 35.1900 |
ICICI Prudential Quant | -9.15% | 24.1500 | 21.9400 |
SBI HEALTHCARE OPPORTUNITIES | -6.09% | 501.3956 | 470.8493 |
Fund | Fall | 52w high NAV | NAV (24-Jan-2025) |
---|---|---|---|
Sundaram Dividend Yield | -12.43% | 159.7432 | 139.8907 |
UTI-Dividend Yield | -11.98% | 203.8115 | 179.3903 |
ICICI Prudential Dividend Yield Equity | -11.71% | 60.3900 | 53.3200 |
Templeton India Equity Income | -10.77% | 164.5244 | 146.7980 |
Fund | Fall | 52w high NAV | NAV (24-Jan-2025) |
---|---|---|---|
ICICI Prudential Large & Mid Cap | -10.58% | 1136.2200 | 1015.9800 |
SBI LARGE & MIDCAP | -9.58% | 677.9683 | 613.0409 |
Fund | Fall | 52w high NAV | NAV (24-Jan-2025) |
---|---|---|---|
Nippon India Balanced Advantage | -5.27% | 197.4901 | 187.0891 |
Fund | Fall | 52w high NAV | NAV (24-Jan-2025) |
---|---|---|---|
SBI CONTRA | -10.38% | 440.4668 | 394.7537 |
Related:
Analyze Your Mutual Fund Portfolio for Free with Arthgyaan's Mutual Fund Review Service
There are three key takeaways from this data:
1. Email me with any questions.
2. Use our goal-based investing template to prepare a financial plan for yourself.Don't forget to share this article on WhatsApp or Twitter or post this to Facebook.
Discuss this post with us via Facebook or get regular bite-sized updates on Twitter.
More posts...Disclaimer: Content on this site is for educational purpose only and is not financial advice. Nothing on this site should be construed as an offer or recommendation to buy/sell any financial product or service. Please consult a registered investment advisor before making any investments.
This post titled Top Mutual Funds with High Returns & Low Risk for Bottom Fishing first appeared on 26 Jan 2025 at https://arthgyaan.com