Best Mutual Funds for SWP: Fixed and Step-Up (with Free SWP Calculator)
This article has an always updated list of mutual fund categories along with their SWP returns for the short, medium, and long term.
 Mutual Funds
This article has an always updated list of mutual fund categories along with their SWP returns for the short, medium, and long term.

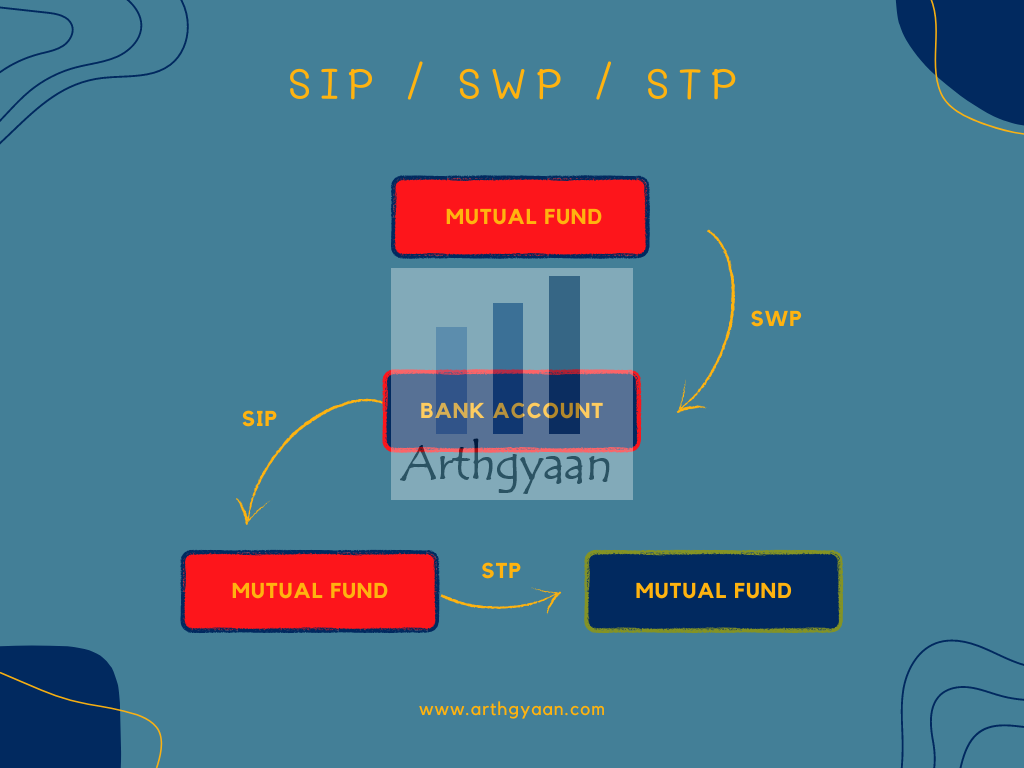
All of these are standing instructions that get executed as per a schedule you specify:
Calculating returns from SWP is tricky since it all depends on how much you start with in mutual funds (the starting corpus), how much you withdraw (the SWP amount) every month, the return of the underlying fund and the time of withdrawal. The table below shows the effect of changing one criterion while keeping the other three constant for two investors. As a millennial growing up in the 90s, it is easy to name these investors Sachin and Vinod.
| What changes? |
What doesn’t change? |
Sachin | Vinod | Whose case is better? |
|---|---|---|---|---|
| Starting Corpus | SWP amount; Return; Time |
₹20 lakhs | ₹10 lakhs | Sachin |
| SWP amount | Starting Corpus; Return; Time |
₹10,000 /month |
₹5,000 /month |
Vinod |
| Return | Starting Corpus; SWP amount; Time |
15%/year | 10%/year | Sachin |
| Time | Starting Corpus; SWP amount; Return |
15Y SWP | 10Y SWP | Vinod |
So, if we summarise these factors:
| Factor | How does it matter? | Comment |
|---|---|---|
| Starting Corpus | Higher is Better | More the starting amount more you can withdraw or allow to grow |
| SWP amount | Lower is Better | Lesser SWP amount means that more from portfolio is left to grow |
| Return | Higher is Better | Higher the return more is the corpus growth and more you can withdraw |
| Time | Lower is Better | Small the time period of withdrawal more is the corpus left |
Therefore, to keep things simple, we will assume that the starting portfolio, when the SWP starts, has the same total number of units as sold for the SWP return calculation. This assumption means that if an average of 1,000 units are sold over 10 years via SWP, then the portfolio has 12,000 units in the beginning.
We will now see SWP performance for 5,7 and 10-year withdrawal periods. To simulate real-world inflation, we will show both fixed and 10% annual step-ups in the withdrawals.
| Category | Minimum | Median | Maximum |
|---|---|---|---|
| Equity: Large Cap | 7.5% | 13.98% | 25.62% |
| Equity: Mid Cap | 12.93% | 21.84% | 36.56% |
| Equity: Small Cap | 14.04% | 26.72% | 51.54% |
| Hybrid: Aggressive | 8.35% | 13.56% | 24.73% |
| Hybrid: Conservative | 5.74% | 9.01% | 13.46% |
| Hybrid: Equity Savings | 7.07% | 9.73% | 12.7% |
| Commodity: Gold | -3.73% | 6.78% | 17.54% |
| ["Category" | "Minimum" | "Median" | "Maximum"] |
|---|---|---|---|
| Equity: Large Cap | 17.98% | 19.32% | 20.33% |
| Equity: Mid Cap | 28.18% | 29.18% | 30.75% |
| Equity: Small Cap | 34.37% | 35.7% | 37.66% |
| Hybrid: Aggressive | 18.25% | 19.2% | 20.2% |
| Hybrid: Conservative | 9.2% | 9.46% | 9.74% |
| Hybrid: Equity Savings | 10.58% | 11.01% | 11.39% |
| Commodity: Gold | 8.21% | 8.81% | 9.4% |
| ["[\"Category\"" | " \"Minimum\"" | " \"Median\"" | " \"Maximum\"]"] |
|---|---|---|---|
| Equity: Large Cap | 10.03% | 13.35% | 18.65% |
| Equity: Mid Cap | 15.41% | 17.2% | 22.21% |
| Equity: Small Cap | 17.26% | 18.7% | 21.11% |
| Hybrid: Aggressive | 11.17% | 12.73% | 15.99% |
| Hybrid: Conservative | 7.84% | 8.5% | 9.77% |
| Hybrid: Equity Savings | 8.65% | 9.0% | 9.48% |
| Commodity: Gold | 7.9% | 11.83% | 17.71% |
| ["[\"[\\\"Category\\\"\"" | " \" \\\"Minimum\\\"\"" | " \" \\\"Median\\\"\"" | " \" \\\"Maximum\\\"]\"]"] |
|---|---|---|---|
| Equity: Large Cap | 13.93% | 14.37% | 15.22% |
| Equity: Mid Cap | 18.67% | 18.98% | 19.62% |
| Equity: Small Cap | 19.73% | 20.39% | 21.56% |
| Hybrid: Aggressive | 13.67% | 13.95% | 14.6% |
| Hybrid: Conservative | 8.73% | 8.82% | 9.0% |
| Hybrid: Equity Savings | 9.12% | 9.29% | 9.58% |
| Commodity: Gold | 16.03% | 16.73% | 17.35% |
| ["[\"[\\\"[\\\\\\\"Category\\\\\\\"\\\"\"" | " \" \\\" \\\\\\\"Minimum\\\\\\\"\\\"\"" | " \" \\\" \\\\\\\"Median\\\\\\\"\\\"\"" | " \" \\\" \\\\\\\"Maximum\\\\\\\"]\\\"]\"]"] |
|---|---|---|---|
| Equity: Large Cap | 12.27% | 14.36% | 17.08% |
| Equity: Mid Cap | 13.64% | 15.99% | 18.24% |
| Equity: Small Cap | 14.07% | 14.88% | 15.99% |
| Hybrid: Aggressive | 11.73% | 13.31% | 14.85% |
| Hybrid: Conservative | 8.35% | 8.67% | 9.31% |
| Hybrid: Equity Savings | 8.56% | 8.72% | 8.95% |
| Commodity: Gold | 6.55% | 7.64% | 9.3% |
| ["[\"[\\\"[\\\\\\\"[\\\\\\\\\\\\\\\"Category\\\\\\\\\\\\\\\"\\\\\\\"\\\"\"" | " \" \\\" \\\\\\\" \\\\\\\\\\\\\\\"Minimum\\\\\\\\\\\\\\\"\\\\\\\"\\\"\"" | " \" \\\" \\\\\\\" \\\\\\\\\\\\\\\"Median\\\\\\\\\\\\\\\"\\\\\\\"\\\"\"" | " \" \\\" \\\\\\\" \\\\\\\\\\\\\\\"Maximum\\\\\\\\\\\\\\\"]\\\\\\\"]\\\"]\"]"] |
|---|---|---|---|
| Equity: Large Cap | 12.64% | 13.06% | 13.8% |
| Equity: Mid Cap | 14.15% | 14.49% | 15.32% |
| Equity: Small Cap | 14.76% | 15.12% | 15.91% |
| Hybrid: Aggressive | 11.77% | 12.07% | 12.63% |
| Hybrid: Conservative | 8.27% | 8.36% | 8.54% |
| Hybrid: Equity Savings | 8.6% | 8.74% | 8.94% |
| Commodity: Gold | 11.36% | 11.73% | 12.07% |
This data supports the unsuitability of gold (post-tax returns comparable to FD in the average case and negative worst-case returns) for SWP vs. the other categories in the table.
You can use this step-up SWP calculator to see how much returns you can get from SWP:
Total Withdrawal (₹):
Remaining Value (₹):
Inflation-Adjusted Value (₹):
Uncertainty-Adjusted Range (₹):
If you found this useful, check out the Arthgyaan step-up SIP calculator.
Published: 18 December 2025
8 MIN READ
1. Email me with any questions.
2. Use our goal-based investing template to prepare a financial plan for yourself.Don't forget to share this article on WhatsApp or Twitter or post this to Facebook.
Discuss this post with us via Facebook or get regular bite-sized updates on Twitter.
More posts...Disclaimer: Content on this site is for educational purpose only and is not financial advice. Nothing on this site should be construed as an offer or recommendation to buy/sell any financial product or service. Please consult a registered investment advisor before making any investments.
This post titled Best Mutual Funds for SWP: Fixed and Step-Up (with Free SWP Calculator) first appeared on 11 May 2025 at https://arthgyaan.com