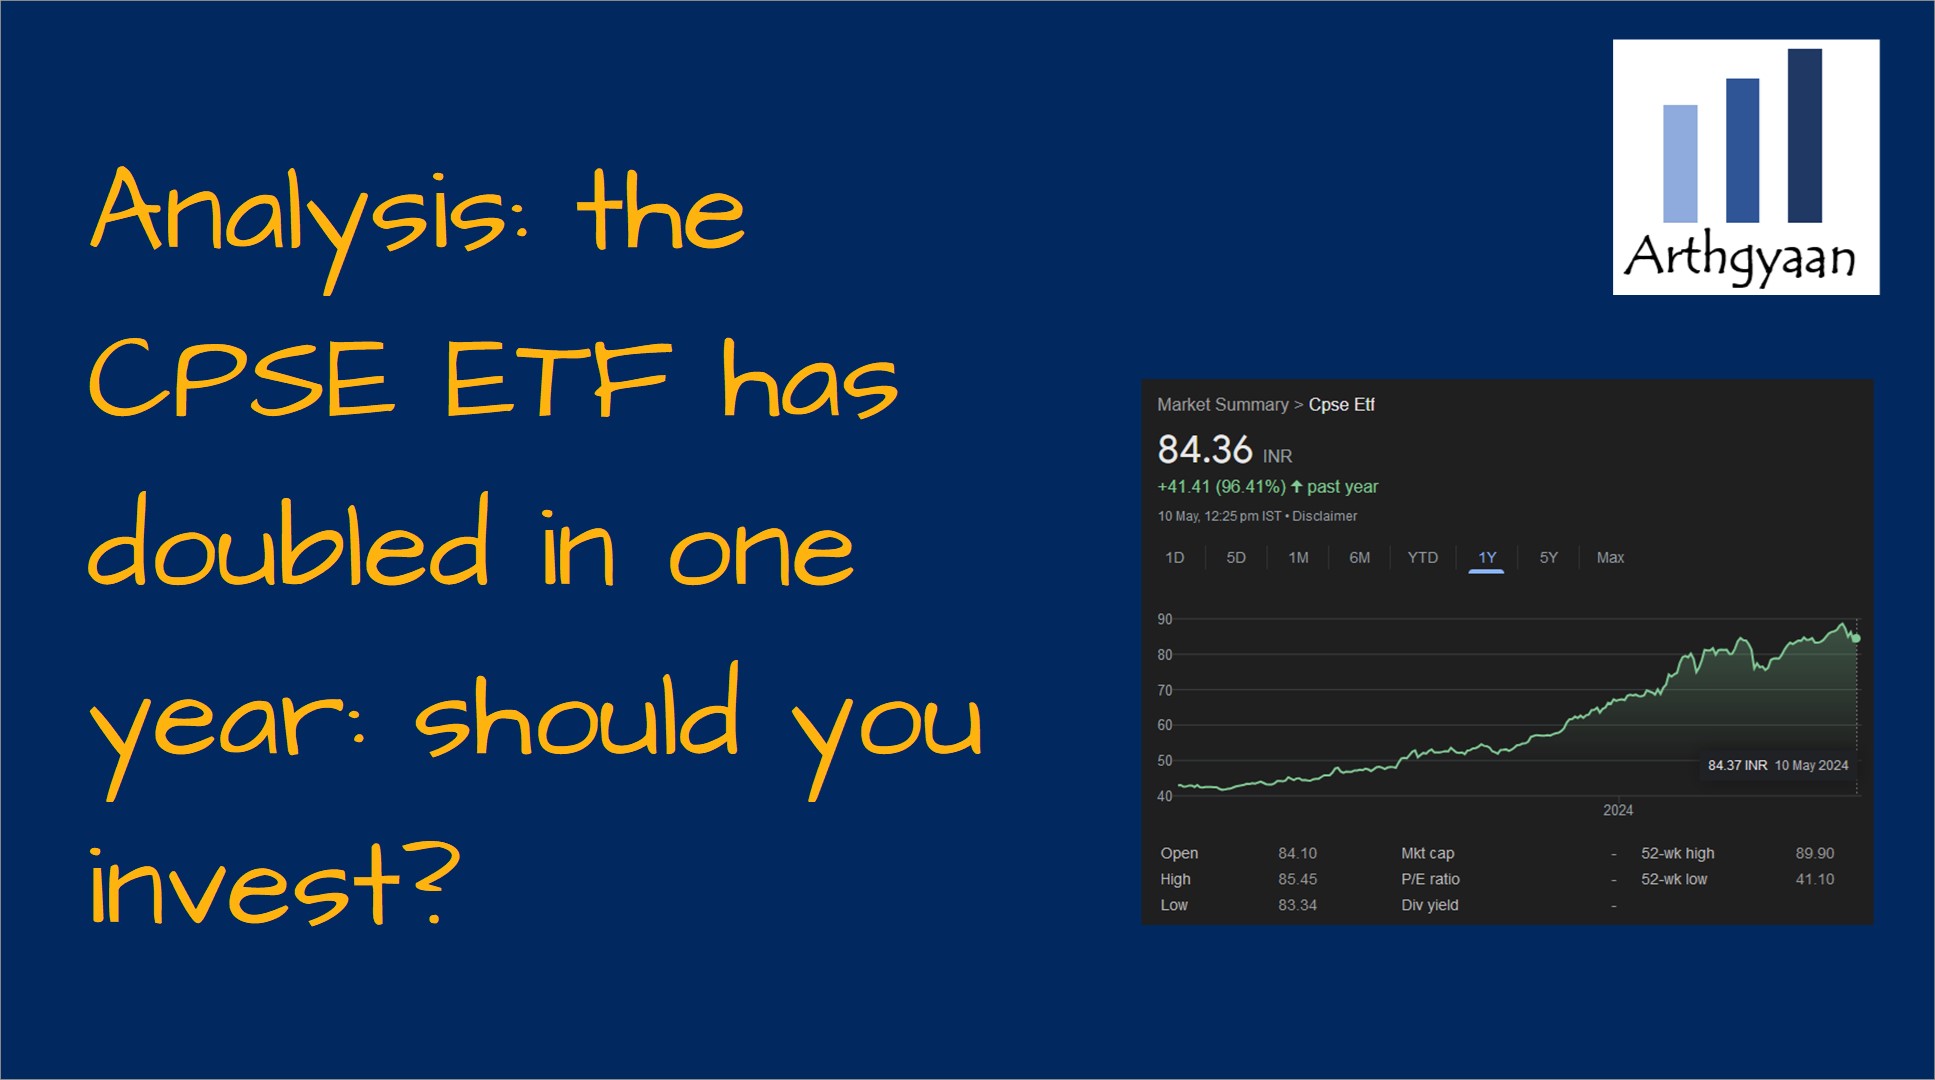
Analysis: the CPSE ETF has doubled in one year: should you invest?
This article explores the CPSE Index and the ETF tracking it to determine its suitability for your investment portfolio.
This article explores the CPSE Index and the ETF tracking it to determine its suitability for your investment portfolio.

Launched in Mar-2014 by Nippon India AMC, the CPSE ETF tracks the Nifty CPSE Index. The Nifty CPSE Index was developed to support the Government of India’s initiative to divest stakes in certain Central Public Sector Enterprises (CPSEs) via the ETF route.
In essence:
The ETF includes stocks selected by the Department of Disinvestment to meet specific criteria. According to the Apr 2024 factsheet, the Nifty CPSE Index comprises:
| Company | ETF Weight |
|---|---|
| NTPC Ltd. | 20.23% |
| Power Grid Corporation of India Ltd. | 19.80% |
| Oil & Natural Gas Corporation Ltd. | 17.15% |
| Coal India Ltd. | 16.10% |
| Bharat Electronics Ltd. | 13.02% |
| NHPC Ltd. | 4.66% |
| Oil India Ltd. | 3.45% |
| NBCC (India) Ltd. | 1.49% |
| SJVN Ltd. | 1.48% |
| Cochin Shipyard Ltd. | 1.44% |
The primary sectors covered by the ETF are:
| Sector | ETF Weight |
|---|---|
| Power | 47.36% |
| Oil, Gas & Consumable Fuels | 36.70% |
| Capital Goods | 14.45% |
| Construction | 1.49% |
From an investment perspective, over 86% of the ETF’s value is concentrated in five stocks: NTPC, Power Grid, ONGC, Coal India, and Bharat Electronics. The performance of these stocks significantly influences the ETF’s overall performance.

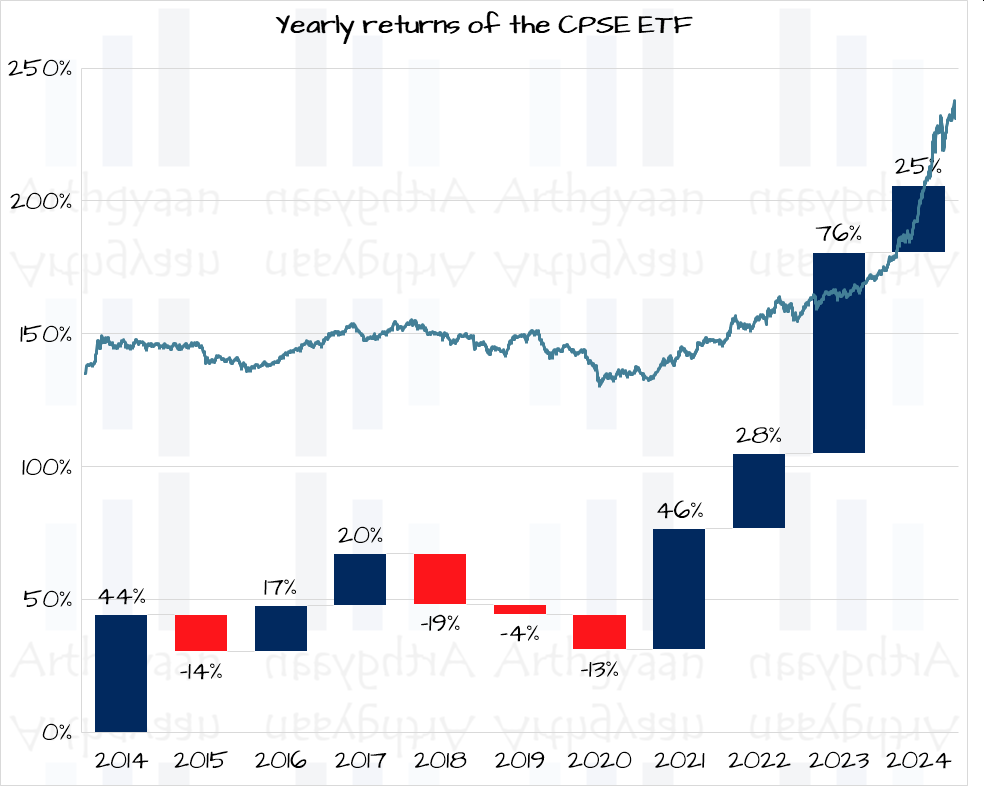
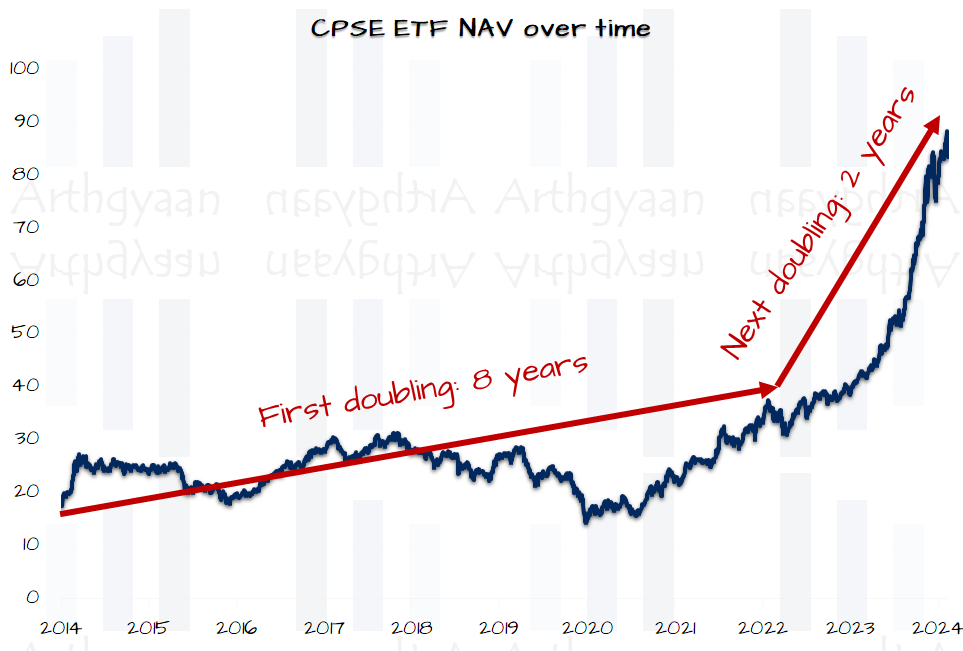
The annual returns of the CPSE ETF vary significantly depending on the year. Notably, PSU stocks, including those within this ETF, have seen considerable fluctuations, with significant recoveries following low-performing years in 2018 through 2020.
Investors might consider allocating a portion of their equity portfolio to this ETF if they:
Investors who meet these criteria are likely to already have substantial investments in this ETF or its constituent stocks.

| Year | Year-end NAV | Yearly return | CAGR since inception |
|---|---|---|---|
| Inception | 17.33 | – | – |
| 2014 | 25.01 | 44% | 61.91% |
| 2015 | 21.49 | -14% | 12.99% |
| 2016 | 25.25 | 17% | 14.59% |
| 2017 | 30.18 | 20% | 15.89% |
| 2018 | 24.41 | -19% | 7.46% |
| 2019 | 23.46 | -4% | 5.40% |
| 2020 | 20.36 | -13% | 2.41% |
| 2021 | 29.68 | 46% | 7.18% |
| 2022 | 38.06 | 28% | 9.39% |
| 2023 | 66.88 | 76% | 14.84% |
| 2024# | 83.76 | 25% | 16.85% |
(# 2024 NAV is for 9 May)
Investors should consider avoiding this ETF if they:

Published: 23 December 2025
6 MIN READ

Published: 18 December 2025
8 MIN READ
1. Email me with any questions.
2. Use our goal-based investing template to prepare a financial plan for yourself.Don't forget to share this article on WhatsApp or Twitter or post this to Facebook.
Discuss this post with us via Facebook or get regular bite-sized updates on Twitter.
More posts...Disclaimer: Content on this site is for educational purpose only and is not financial advice. Nothing on this site should be construed as an offer or recommendation to buy/sell any financial product or service. Please consult a registered investment advisor before making any investments.
This post titled Analysis: the CPSE ETF has doubled in one year: should you invest? first appeared on 12 May 2024 at https://arthgyaan.com
Copyright © 2021-2025 Arthgyaan.com. All rights reserved.