Arthgyaan India Active Fund Scorecard (Dec-2023)
This is the first release of the Arthgyaan India Active Fund Scorecard to help mutual fund investors in India make better investment decisions.
 Research
This is the first release of the Arthgyaan India Active Fund Scorecard to help mutual fund investors in India make better investment decisions.

Disclaimer: Please do your own research or take professional help before investing in mutual funds. The article does not have any fund names.
We have created a scorecard similar to the “S&P Indices versus Active (SPIVA) U.S. Scorecard” that is published regularly by S&P Global.
The purpose of this scorecard is to help Indian mutual fund investors make a conscious choice regarding fund categories for different investment horizons.
Since this scorecard talks about active funds, we will immediately discuss the most interesting part of the analysis below.
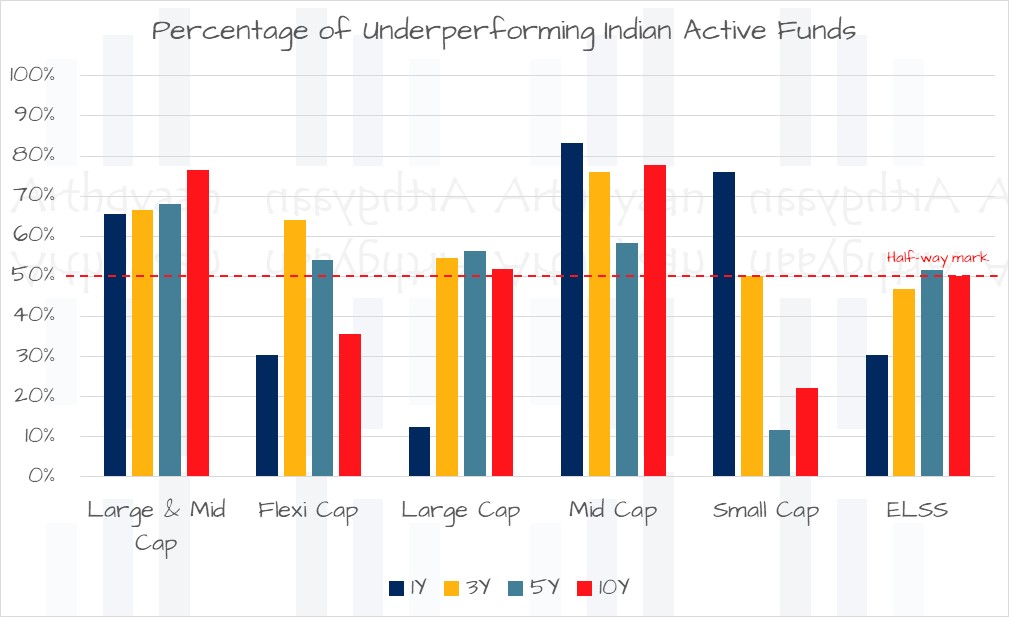
We have taken multiple fund categories and counted how many funds in each category has beaten their respective benchmark or not for each of the holding periods: 1Y, 3Y etc. This chart deals with lump sum returns only.
There are two ways to read this chart:
We have taken inspiration from the S&P SPIVA report and have performed analogous analysis for active mutual funds in India for the previous 10 years. We do not claim, and nor should it be inferred, that our analysis will give the same results as the SPIVA report for the same period.
We will follow this process regarding gathering data and analysing:
| Category | Benchmark |
|---|---|
| Large & Mid Cap | Nifty LargeMidcap 250 TRI |
| Flexi Cap | Nifty 500 TRI |
| Large Cap | Nifty 100 TRI |
| Mid Cap | Nifty Midcap 150 TRI |
| Small Cap | Nifty Smallcap 250 TRI |
| ELSS | Nifty 500 TRI |
Only the above fund categories are analysed.
We would like to point out that of all the fund categories, the Flexi cap category is the hardest to benchmark correctly. For example, some Flexi cap funds invest in international stocks along with domestic stocks. A better benchmark for such a fund will be a blended index with both Indian and international stocks.
We have adjusted for survivorship bias by assuming that all funds that existed in the past and do not exist today (by either merger or discontinuation) have not beaten the benchmark.
In each period below, we have shown a simple count of all funds in that category which have beaten or not beaten the respective benchmark index. For example, in the 1-year returns, this table means:
| Category | Total | Beaten | Beaten % | Not Beaten | Not Beaten % |
|---|---|---|---|---|---|
| Large & Mid Cap | 29 | 10 | 34% | 19 | 66% |
There are 29 funds in the Large & Mid Cap category at the beginning of the period. Of these funds, 10 funds have a higher return than the benchmark Nifty LargeMidcap 250 TRI index. So, 10/29 = 34% of funds have beaten the benchmark and the other 66% have not. The “not beaten” category includes funds merged or discontinued in this period. This choice adjusts for survivorship bias.
Before you proceed further, please remember that:
Past performance has no relationship with future returns. Please read all scheme related documents carefully before investing.
| Category | Total | Beaten | Beaten % | Not Beaten | Not Beaten % |
|---|---|---|---|---|---|
| Large & Mid Cap | 29 | 10 | 34% | 19 | 66% |
| Flexi Cap | 33 | 23 | 70% | 10 | 30% |
| Large Cap | 32 | 28 | 88% | 4 | 13% |
| Mid Cap | 30 | 5 | 17% | 25 | 83% |
| Small Cap | 25 | 6 | 24% | 19 | 76% |
| ELSS | 33 | 23 | 70% | 10 | 30% |
| Total | 182 | 95 | 52% | 87 | 48% |
| Category | Total | Beaten | Beaten % | Not Beaten | Not Beaten % |
|---|---|---|---|---|---|
| Large & Mid Cap | 30 | 10 | 33% | 20 | 67% |
| Flexi Cap | 25 | 9 | 36% | 16 | 64% |
| Large Cap | 33 | 15 | 45% | 18 | 55% |
| Mid Cap | 25 | 6 | 24% | 19 | 76% |
| Small Cap | 22 | 11 | 50% | 11 | 50% |
| ELSS | 32 | 17 | 53% | 15 | 47% |
| Total | 167 | 68 | 41% | 99 | 59% |
| Category | Total | Beaten | Beaten % | Not Beaten | Not Beaten % |
|---|---|---|---|---|---|
| Large & Mid Cap | 25 | 8 | 32% | 17 | 68% |
| Flexi Cap | 24 | 11 | 46% | 13 | 54% |
| Large Cap | 32 | 14 | 44% | 18 | 56% |
| Mid Cap | 24 | 10 | 42% | 14 | 58% |
| Small Cap | 17 | 15 | 88% | 2 | 12% |
| ELSS | 31 | 15 | 48% | 16 | 52% |
| Total | 153 | 73 | 48% | 80 | 52% |
| Category | Total | Beaten | Beaten % | Not Beaten | Not Beaten % |
|---|---|---|---|---|---|
| Large & Mid Cap | 17 | 4 | 24% | 13 | 76% |
| Flexi Cap | 14 | 9 | 64% | 5 | 36% |
| Large Cap | 29 | 14 | 48% | 15 | 52% |
| Mid Cap | 18 | 4 | 22% | 14 | 78% |
| Small Cap | 9 | 7 | 78% | 2 | 22% |
| ELSS | 26 | 13 | 50% | 13 | 50% |
| Total | 113 | 51 | 45% | 62 | 55% |

1. Email me with any questions.
2. Use our goal-based investing template to prepare a financial plan for yourself.Don't forget to share this article on WhatsApp or Twitter or post this to Facebook.
Discuss this post with us via Facebook or get regular bite-sized updates on Twitter.
More posts...Disclaimer: Content on this site is for educational purpose only and is not financial advice. Nothing on this site should be construed as an offer or recommendation to buy/sell any financial product or service. Please consult a registered investment advisor before making any investments.
This post titled Arthgyaan India Active Fund Scorecard (Dec-2023) first appeared on 19 Feb 2024 at https://arthgyaan.com